
CSAT vs. NPS: Benchmarks, Scores, and When to Use Each
You are staring at a survey score and you don't know if it is good. You have no idea if the number signals a real problem or just normal noise. This confusion is exactly why understanding CSAT vs NPS is crucial for your business. CSAT and NPS measure different things at entirely different moments. Most businesses pick one metric and completely miss what the other catches.
Customer Satisfaction Score (CSAT) measures how satisfied a customer is with one specific interaction. Net Promoter Score℠ (NPS®) measures whether the overall relationship is strong enough that they'd recommend you. Run both at the right cadence, and you catch at-risk customers before they leave quietly.

Main Takeaways
- Customer Satisfaction Score measures specific interaction satisfaction, while Net Promoter Score measures relationship loyalty and recommendation likelihood.
- The math differs significantly. CSAT is the percentage of 4s and 5s among responses. NPS subtracts the percentage of Detractors from the percentage of Promoters, producing a score from −100 to +100.
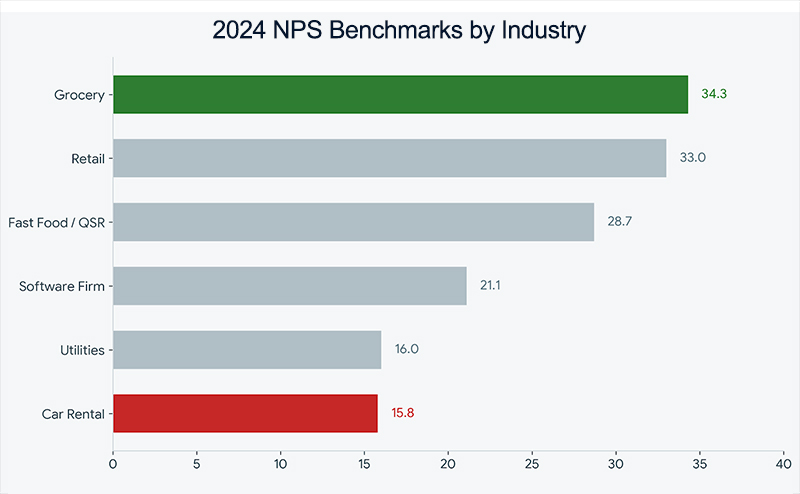
- Good scores are always industry-relative. The 2024 industry-average NPS spans from 15.8 in car rental to 34.3 in grocery. A top-box CSAT above 75% is solid across most service industries.
- Cadence rules prevent survey fatigue. Send CSAT within 24 hours of a transaction, send NPS no more than once every 90 days, and when both fire at once, keep the CSAT and catch the NPS next cycle.
- The score is a signal rather than the answer. Follow up with unhappy customers within 24 hours, solicit referrals from your Promoters, and keep review requests running as a standing part of the program.
Start with the Score You'll Use First
CSAT tells you what just happened. NPS tells you whether the relationship is strong enough to last. If you are starting with CSAT, get the calculation right from day one.
What CSAT vs. NPS Actually Measure
CSAT measures how satisfied a customer is with a specific interaction. NPS measures whether that customer would recommend your business to someone else. The operational difference between those two questions determines everything about how you use them.
CSAT: The Transaction Metric
CSAT is a transactional metric tied to a specific moment. This could be a service call, a product delivery, or a support ticket resolution.
The standard CSAT survey asks a simple question: "How satisfied were you with [interaction]?". Responses are typically measured on a 1-5 scale, though other variants exist. This scale captures the customer's immediate reaction to one experience. It does not capture their overall feeling about your entire business.
NPS: The Relationship Metric
NPS is a relationship metric that captures long-term loyalty and likelihood to recommend. It takes a broader view of the customer experience.
The standard NPS survey question asks: "How likely are you to recommend [company] to a friend or colleague?". Customers respond on a 0-10 scale, sorting them into three segments:
- Promoters (9-10): These are your loyal advocates.
- Passives (7-8): These customers are satisfied but unenthusiastic.
- Detractors (0-6): These customers are at risk of leaving or warning others away.
Why the Difference Matters
The core operational difference comes down to the scope of feedback. CSAT tells you whether a specific touchpoint worked. NPS tells you whether the overall relationship is healthy enough that the customer will stay and refer.
A customer can easily give a 5/5 CSAT on a support ticket and still be an NPS Detractor. They might have liked the quick fix, but they are frustrated because the product keeps breaking. Conversely, an NPS Promoter might give a low CSAT after one bad interaction. Their overall relationship is strong, but you just dropped the ball on that specific day.
Misreading one metric as the other leads to fixing the wrong problems. Both scores matter, but they serve completely different diagnostic purposes.
How to Calculate Your CSAT Score
Your CSAT score is the percentage of customers who rated their experience as satisfied or very satisfied. You calculate this by dividing satisfied responses by total responses, then multiplying by 100.
CSAT % = (Number of satisfied responses ÷ Total responses) × 100
We recommend using the top-box method to define "satisfied responses". On a standard 1-5 scale, you only count the 4s and 5s. This is the most common approach and the one most published benchmarks reference. While some businesses use an average-score alternative (like 4.2 out of 5), that method is harder to benchmark against industry data.
Let's look at a quick example. Imagine 80 customers respond to your survey, and 62 rate you a 4 or 5. CSAT = (62 ÷ 80) × 100 = 77.5%.
The top-box CSAT percentage gives you a clean, comparable number. Pick one method and stick with it so your trend line actually means something over time.
How to Calculate Your Net Promoter Score
Your NPS is the percentage of Promoters minus the percentage of Detractors. This produces a final score that ranges from −100 to +100.
NPS = % Promoters − % Detractors
Passives (7-8) count in the total response pool, but they are excluded from the actual calculation. In practical terms, Passives dilute your Promoter percentage without moving your NPS directly. However, they represent your biggest conversion opportunity. They are just one experience away from becoming a Promoter or a Detractor.
Let's look at a quick calculation example. Imagine 100 customers respond to your survey. Fifty give a 9-10 (Promoters), thirty give a 7-8 (Passives), and twenty give a 0-6 (Detractors). NPS = 50% − 20% = +30.
As a general orientation, anything above 0 means you have more Promoters than Detractors. A score above +50 is considered excellent, and anything above +70 is world-class. Track NPS as a trend rather than a snapshot. A score that moves five points in either direction over two quarters tells you more than any single reading.
What Good Scores Look Like by Industry
A "good" CSAT or NPS score is completely meaningless without industry context. For example, an NPS of +30 runs nearly ten points above the average for software firms, but it sits below the grocery average.
NPS Benchmarks by Industry
NPS benchmarks vary dramatically by industry. Customer expectations, switching costs, and competitive density differ wildly across verticals. Qualtrics XM Institute's 2024 US consumer benchmark study, which surveyed 10,000 consumers regarding 354 companies, found that industry-average NPS spans from 15.8 to 34.3 across 22 industries. Keep in mind that internally measured NPS typically runs higher than third-party benchmark NPS. Compare your trend against the industry's direction rather than strictly matching your absolute score against the table.
NPS Benchmarks by Vertical
| Industry | 2024 Industry-Average NPS | What Drives the Score |
|---|---|---|
| Grocery | 34.3 | Highest-scoring US vertical: frequent, low-friction transactions and strong price-value perception |
| Retail | 33.0 | Near the top: high competition forces experience quality, and switching is effortless |
| Fast Food / QSR | 28.7 | Above the middle of the pack, pulled up by category leaders |
| Software Firm | 21.1 | Below the midpoint: complexity, support friction, and switching costs suppress advocacy |
| Utilities | 16.0 | Second-lowest: captive customers with little choice rarely become Promoters |
| Car Rental | 15.8 | Lowest of all 22 industries: infrequent, stressful, fee-laden transactions |
Category leaders can heavily influence these numbers. After leading quick-service restaurant satisfaction for 11 straight years, Chick-fil-A lost the top spot in the 2026 American Customer Satisfaction Index (ACSI). Jersey Mike's edged them out 84 to 83 out of 100. Chick-fil-A's score actually held steady; the competition simply moved. While third-party estimates constantly place Chick-fil-A among the highest for NPS in QSR, they don't publish official scores. The verifiable number is the ACSI index, which uses a 0-100 scale distinct from both CSAT and NPS.
For businesses like home services, MSPs, and professional services, expect to benchmark closer to the software-firm range (roughly NPS 15-30). Complex relationships and high expectations naturally suppress these scores compared to grocery or retail.
What Is a Good CSAT Score?
CSAT benchmarks are less standardized than NPS. Companies use different scales (1-5, 1-7, 1-10, 0-10) and different calculation methods, making direct comparisons difficult.
As general guidance, a top-box CSAT above 75% is considered good across most industries. Anything above 85% is strong, and above 90% is exceptional.
The macro benchmark environment is currently turning. Customer experience quality hit an all-time low in Forrester's 2024 US CX Index. However, the 2026 CX Index™ shows a measurable recovery in North America. According to Forrester, 26% of US and Canadian brands posted statistically significant gains, against just 7% that declined. When the whole environment was falling in 2024, a flat score could mask solid service. Today, a flat score means you are losing ground to competitors who are actively getting better.
Your scores only mean something against two baselines: your own trend line and your industry's average. A number without context is just a number.
NPS vs. CSAT vs. CES: The Full Comparison
CSAT, NPS, and Customer Effort Score (CES) each measure a different dimension of the customer experience. Most businesses benefit immensely from using at least two of these metrics.
Each metric answers a different question, fires at a different moment, and reveals a completely different risk. Use the table below to see where they overlap and where they leave gaps.
| Dimension | CSAT | NPS | CES |
|---|---|---|---|
| Primary question | "How satisfied were you with [interaction]?" | "How likely are you to recommend us?" | "How easy was it to [resolve your issue / complete your task]?" |
| Scale | 1-5 (most common) | 0-10 | 1-5 or 1-7 |
| Timing | Immediately after a specific interaction | Periodically (quarterly or semi-annually) | After a support or self-service interaction |
| What it measures | Satisfaction with a single touchpoint | Overall loyalty and likelihood to recommend | Friction and effort in a specific process |
| What it misses | Long-term loyalty and relationship health | Specific interaction quality | Satisfaction and emotional sentiment |
| Best use case | Post-transaction feedback, service quality | Relationship tracking, renewal risk, executive reporting | Support experience, onboarding, self-service flows |
CSAT captures satisfaction at a single touchpoint, NPS captures loyalty across the entire relationship, and CES captures how much effort the customer had to spend to get something done. Most businesses start with NPS and CSAT, then add CES when they want to diagnose friction in specific workflows.
OSAT and DSAT: Two Metrics You'll See Referenced
You may also encounter variants like OSAT and DSAT in the industry.
- Overall Satisfaction (OSAT): This is a CSAT variant asking about the overall experience with the company rather than a specific interaction. Some industries use it for periodic relationship checks.
- Dissatisfaction Score (DSAT): This is the inverse of CSAT. It measures the percentage of customers who rated their experience as dissatisfied (typically 1s and 2s). DSAT spotlights negative experiences and makes problems much harder to hide inside a high average score.
Multi-metric programs are becoming the norm. A 2024 study by Qualtrics XM Institute found that four in five B2B firms use NPS as a core CX metric. Satisfaction follows at 49%, and CES sits at 28%, with all three rising since 2022. No single metric covers every dimension. The real question is which combination gives you the clearest picture.
When to Use CSAT vs. NPS, and When to Run Both
Knowing what each metric covers is the foundation. The real decision is when to fire each survey and whether you need both running concurrently.
When CSAT Is the Right Metric
CSAT belongs immediately after a concrete touchpoint. This means after a completed service call, a resolved support ticket, or a new installation. The question is narrow, and the answer tells you whether that specific moment worked.
You must send the CSAT survey within 24 hours while the experience is fresh. Accuracy drops sharply the longer you wait. CSAT is highly diagnostic. When scores drop on a specific touchpoint, you know exactly where to look for broken processes or coaching opportunities.
When NPS Is the Right Metric
NPS belongs firmly at the relationship level. Use it for quarterly or semi-annual check-ins, asking customers if they would recommend you regardless of recent interactions.
NPS is predictive. A rising trend signals growing advocacy and retention strength. A declining trend flags churn risk long before customers actually leave. It is best used for renewal forecasting, executive reporting, and identifying at-risk accounts.
Running Both Without Conflict
Most businesses benefit significantly from running CSAT and NPS concurrently. CSAT catches interaction-level problems, while NPS tracks whether those problems are hurting the overall relationship.
To run both smoothly, follow these three cadence rules:
- Send CSAT within 24 hours of a transaction.
- Send NPS no more than once every 90 days per repeat customer.
- When both trigger for the same customer in the same window, suppress the NPS and let the CSAT go, then catch the NPS in the next cycle.
The logic is simple: CSAT is perishable and NPS is durable. The customer quickly forgets a specific interaction, but their overall relationship does not change overnight. Always prioritize the perishable signal.
Track CSAT and NPS in One Place
Running both metrics means managing two cadences, two alert workflows, and one shared customer list. See how the platform handles that without adding work to your team.
Is NPS Outdated?
If you are committing to NPS, you will inevitably hear the criticism that it is outdated. This debate is worth engaging honestly before you build workflows around the score. NPS remains useful but incomplete, and businesses get the most from it when they pair the score with open-text comments.
The Critiques Worth Taking Seriously
- Independent academic replication failed to confirm the original claim of NPS's clear superiority over other loyalty measures. A 2007 Journal of Marketing study found that NPS was not clearly superior to standard satisfaction metrics for predicting growth.
- Passives are excluded from the formula entirely. A massive customer segment carries absolutely zero weight in the number you track.
- Cultural response bias makes cross-country comparisons highly unreliable.
In 2021, Gartner predicted that more than 75% of organizations would abandon NPS by 2025. The deadline passed, and the decline was real but partial. NPS fell from the second-most popular CX metric in 2023 to eighth place in 2024. A 2025 TELUS Digital/Statista survey found just 23% of US enterprise CX leaders using it to measure performance. Yet, the metric persists. Businesses downgraded NPS within a larger stack of metrics rather than abandoning it completely. Even Gartner softened its stance by 2025, questioning mostly whether NPS should be benchmarked against competitors at all.
Forrester's own benchmark guidance states that NPS is "a loyalty metric, not a direct measure of CX quality," effective only as part of a broader measurement system.
Why NPS Still Earns Its Place
NPS remains the most widely adopted CX metric in B2B for excellent reasons. It is simple to administer, easy for leadership to understand, and incredibly powerful as a directional trend.
The absolute key is to pair NPS with an open-text follow-up. The number tells you something changed; the comment tells you exactly what. As a licensed Net Promoter System supporter, LoyaltyLoop® has watched this debate from the inside.
Treat NPS as a signal rather than a diagnosis. Track the trend, read the comments, and act on what you find, and it remains one of the most useful metrics a business can run.
What to Do After You Collect Scores
Collecting scores without acting on them is worse than not collecting them at all. It trains your team to ignore the data and trains your customers to stop responding. The follow-up is where you actually change outcomes.
The 24-Hour Detractor Response Protocol
When a Detractor responds (0-6), someone on your team must reach out within 24 hours. Bring a genuine question rather than a script: "What happened, and how can we make it right?".
Follow this 5-step framework:
- Receive the alert.
- Contact the customer directly (a phone call beats an email).
- Acknowledge the issue without being defensive.
- Document what you learn.
- Follow up after the resolution to confirm the problem is actually fixed.
Speed matters. A Detractor who hears from you within a day is significantly more likely to stay. This is why we built the Poor Feedback Alert into LoyaltyLoop: it fires immediately when a customer responds negatively, so you know within minutes when someone needs attention.
When CSAT Drops Below Threshold
When CSAT drops below your threshold on a specific touchpoint, the problem is usually operational rather than relational.
Flag the touchpoint for review immediately. Identify whether the issue stems from a specific team member who needs coaching, a process gap that requires redesign, or just a one-time failure. Because CSAT problems are highly specific, they are usually very fixable.

Turning Satisfied Customers Into Reviews and Referrals
Solicit referrals directly from your Promoters. Promoters drive over 80% of referrals, making the referral ask a vital workflow for customers who score 9-10.
Review requests and testimonial capture should run as a standing part of the program. Timing is critical while the experience is fresh, because the goodwill that produced a high score fades quickly. Automation handles the timing perfectly so you never have to remember to ask. A business that systematically asks for referrals and closes the loop on every Detractor will easily outperform a business with higher raw scores that does nothing.
How to Run CSAT and NPS Without Survey Fatigue
Survey fatigue is completely real and measurable. Asking smarter, with clear spacing rules, is the only way to protect your response rates.
A 2024 peer-reviewed study in the Journal of Survey Statistics and Methodology proved that people who were recently surveyed were measurably less likely to respond to a subsequent survey. If you run both CSAT and NPS, you must rely on the three spacing rules covered earlier. Always prioritize the perishable signal (CSAT) over the durable one (NPS).
Manual spacing is highly error-prone at scale, especially for service businesses that interact with customers weekly. This is why we built the Touch Frequency Filter into LoyaltyLoop: it defaults to no more than one survey request every 90 days for repeat customers, so the spacing manages itself. The businesses with the best response rates survey at the exact right moment and never double-ask.
Choosing the Right Metric for Your Business
If you are starting from zero, start with NPS. It is faster to implement, easier to act on, and gives you immediate signals on retention.
Here is a quick decision framework:
- Start with NPS if: You want to track relationship health over time, focus on renewal risk, or need a single number for executive reporting.
- Start with CSAT if: You want to diagnose specific touchpoints, run a high-transaction business, or need quick wins to build internal buy-in.
- Run both if: You have repeat customers, want to catch both interaction-level and relationship-level problems, and can set up spacing rules.
For most businesses, the real answer is both. Forrester's 2024 research found that even a minor improvement in CX quality can add tens of millions of dollars in revenue for large brands. For a service business, the math is proportionally the exact same. Small improvements in how you respond to feedback compound into massive retention over time. Pick the metric that matches your most urgent question, and add the second when you are ready.
Start Measuring What Matters with LoyaltyLoop
You can now confidently choose the right metric for your business, set cadence rules that protect response rates, and build a close-the-loop workflow. These steps ensure you turn scores into action before customers leave quietly.
LoyaltyLoop runs both CSAT and NPS programs for businesses. We handle survey timing, feedback routing, and Detractor alerts so you can act on scores within hours. You get consistent execution across every location, real-time alerts when a Detractor responds, and hard proof that your program is working.
Put Both Scores to Work Without the Setup Headache
Choosing between CSAT and NPS is the easy part. Timing them right, spacing them out, and acting on the results is where programs stall. Schedule a demo to see how LoyaltyLoop runs both for you.
Schedule a DemoFAQs About CSAT vs. NPS
Q: What is the difference between CSAT and NPS?
A: CSAT measures how satisfied a customer is with a specific interaction on a 1-5 scale, while NPS measures whether that customer would recommend your business on a 0-10 scale. CSAT is strictly transactional and tells you what just happened. NPS is relational and tells you what is likely to happen next. A customer can easily give a high CSAT on one interaction and still be an NPS Detractor if the broader relationship is weak.
Q: Can you convert an NPS score to a CSAT score?
A: No. The two metrics use different scales, ask completely different questions, and measure different things. Neither can be derived from the other. They are highly complementary: CSAT covers transaction quality and NPS covers relationship strength. A high CSAT with a low NPS is a diagnostic finding that requires investigation, never a data error.
Q: How often should I send CSAT and NPS surveys without annoying customers?
A: Send CSAT within 24 hours of a transaction, and send NPS no more than once every 90 days per customer. When a customer triggers both in the same window, suppress the NPS and let the CSAT go. Survey fatigue is real; recently surveyed people are less likely to respond to a subsequent survey. Because manual spacing is error-prone, automated frequency controls matter deeply.
Q: What should I do when a Detractor responds to an NPS survey?
A: Contact the customer within 24 hours, by phone where possible, and ask what happened and how you can make it right. Acknowledge the issue without being defensive, document everything you learn, and follow up after the resolution to confirm it is actually fixed. Speed matters heavily. A Detractor who hears from you within a day is significantly more likely to stay.
Q: Can I use CSAT to measure long-term loyalty?
A: No. CSAT measures satisfaction with a specific interaction rather than the overall health of the relationship. A customer can give a 5/5 CSAT on every transaction and still leave when a competitor offers a better process. Running CSAT alone creates a sense of false security. High satisfaction scores simply do not predict churn when the underlying relationship is weak.
Q: Is NPS outdated?
A: No. NPS remains useful but incomplete. It must be combined with an open-ended question to capture the customer's comments, and often times paired with CSAT or CES question to get greater insights into the customer's experience. It remains the most widely adopted CX metric in B2B because it is simple and powerful as a directional trend when paired with open-text follow-up. The score is merely a signal; the value comes from reading the comments.