July 2019

How Often, and How Frequently, Does LoyaltyLoop Send Surveys?
At SurveyAdvantage we believe it is important to gather customer feedback consistently throughout their journey with your business, and equally important to avoid over-surveying andover-touching repeat customers. If a customer buys from you multiple times in a month, we do not feel it serves you nor your customer to ask them for feedback every time. This is why we employ a survey “launch frequency”, and a customer survey “filter frequency”. These two “frequencies” work in combination for your LoyaltyLoop service. Here's how they work...
(1) Survey Launch Frequency
The Survey Launch Frequency is how often we launch a wave of surveys to your customers. This frequency is synonymous with your survey launch schedule, and is determined by you during the setup of your survey, and can be changed by you at any time. Launch frequency options are typically daily, weekly, or monthly.
Each business is different, and the goal should be to survey customers soon after they’ve completed a transaction with you. In some cases, this could mean after the customer has received a product they purchased from you, or after they’ve experienced a service you provide to them.
If your raw customer survey list is sent to us automatically via a scheduled report or automation, this launch schedule and feedback loop operates like clockwork. However, if you manually send your raw customer survey list to us, your launch frequency will be dictated by how often you actually send your data. We recommend setting a calendar reminder to send your data to us on the frequency you’ve chosen.
(2) Customer Filter Frequency
The customer survey Filter Frequency determines how often an individual customer’s email address is sent a request for feedback, regardless of the Launch Frequency. The Filter Frequency is determined by you during the setup process, and can be changed by you at any time. Typical Filter Frequencies are 90-days (default), 120-days and 180-days.
In the case of the default setting of 90-days, this means that LoyaltyLoop, at the time of launch, will filter-out and remove any email address that was sent a request for feedback in the prior 90-days. In the case of repeat customers, this means your repeat customers will receive a single request for feedback every 3 months (90-days).
In addition to the Filter Frequency, we apply other rules to perfect your final survey launch list including the removal of any duplicate email addresses, bad email addresses, and those which you have opted out. Please make note of the exception below.
EXCEPTION: There is one caveat to the Customer Filter Frequency. Since we are sending requests via email, if your customer data includes more than one email address for the same customer contact (e.g. john.smith@gmail.com, johnsmith@anycompany.com), the contact will receive a request for feedback to each unique email address. If you identify contacts with more than one email, either correct it in your source system (POS, billing, CRM, etc.) before they are sent to us, or add one of the email addresses to your LoyaltyLoop Opt-Out list.
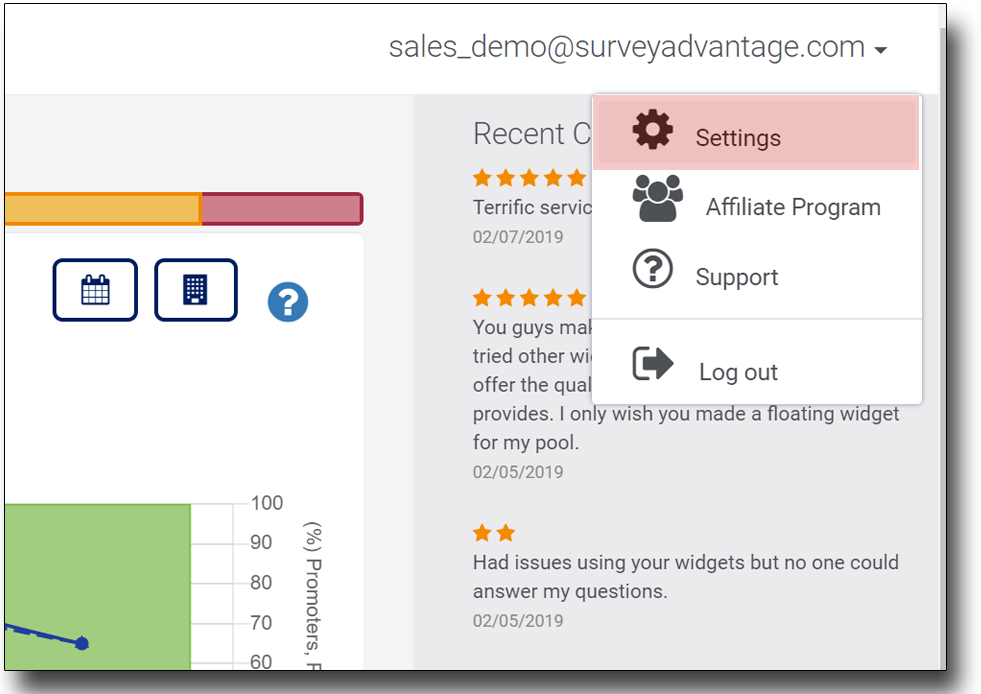
How To Make Changes To LoyaltyLoop Account Settings
Our support team is always ready to pick up the phone and provide technical assistance to you and your team at a moment’s notice. However, if you find yourself too busy to call or email us when resolving a simple issue like changing your email signature, updating a credit card, or other tasks, simply access your LoyaltyLoop Settings for self-service. Understanding your Settings page will allow you to make changes to a number of account preferences including the following…
- Updating your survey messaging (i.e. invitation email, reminder email, thank you pages, email signatures, etc.
- Adjusting testimonial publisher settings
- Adding and removing LoyaltyLoop users
- Creating and making edits to email campaign templates
- Securely updating your billing information
To access your account Settings, simply log in and click on your username in the top righthand corner.
Do You Use QuickBooks Online?

Did you know Quickbooks Online (QBO) has a standard feature that allows you to create and save reports, then automatically email them on a specific recurring schedule? If you record customer email addresses in your QBO when sending estimates, invoices or receipts, then you can automate the sending of your raw survey launch list to SurveyAdvantage, eliminating the need for manually generating and sending your survey list.
Our experts can help you configure an automated QBO transaction report, or you can follow our Export Guide for QuickBooks Online. The report can include a number of fields including email address, however it does not include first or last name. Once this export report has been configured, your raw survey data can be automatically sent to SurveyAdvantage on your selected schedule, allowing your feedback loop to operate like clockwork.
Users of Quickbooks Online can also utilize our Zapier integration as an alternative to the free automated report mentioned above. The Zapier integration gives you access to a greater number of QBO fields to include in your report. Simply create a Zapier account and follow our Guide for Integrating LoyaltyLoop and QuickBooks Online via Zapier. Our support team is always available to walk you through these configurations or you can reference our helpful pdf guides for each option.
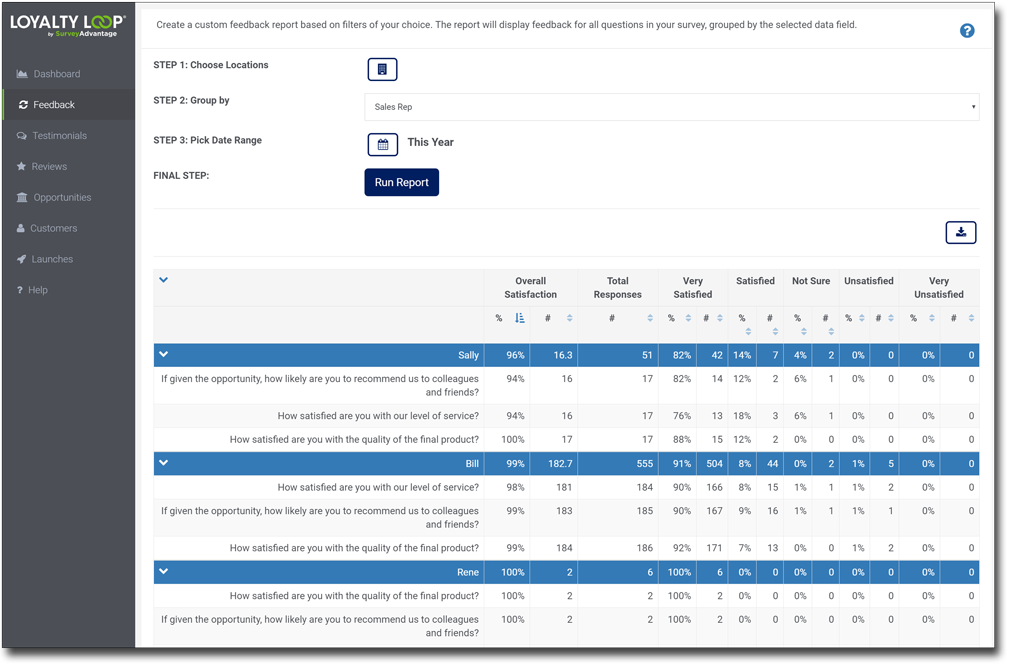
NEW FEATURE: Updated Feedback by Filter creates Summary Reports
If you include additional details with your raw survey launch data, such as sales rep, CSR, technician, region, or other data by which you associate your customers, check out the new Feedback by Filter report. This report allows you to view the satisfaction of your customers grouped by an associated field. The resulting report allows you to see how feedback and satisfaction varies for each element in the group. For example, if you include the field Sales Rep, you can view how customer satisfaction varies by the sales rep with whom they work.
To use this new powerful feature, go to Feedback by Filter. Choose your location (or locations) that you’d like to view, then select the field by which you’d like the results grouped, select the date range, and finally click Run Report. By default, results are sorted by Overall Satisfaction. Rows can be collapsed so you can view the top-level comparisons.
If your survey uses a 5-point scale, Overall Satisfaction is calculated by taking the sum of the number of respondents to the top 2 choices (Very Satisfied and Satisfied) and dividing it by the total number of respondents, then multiplying by 100 to represent the figure as a percent. If your survey uses the 11-point scale, the top 2 choices include customers who responded with a choice of 7, 8, 9 or 10.
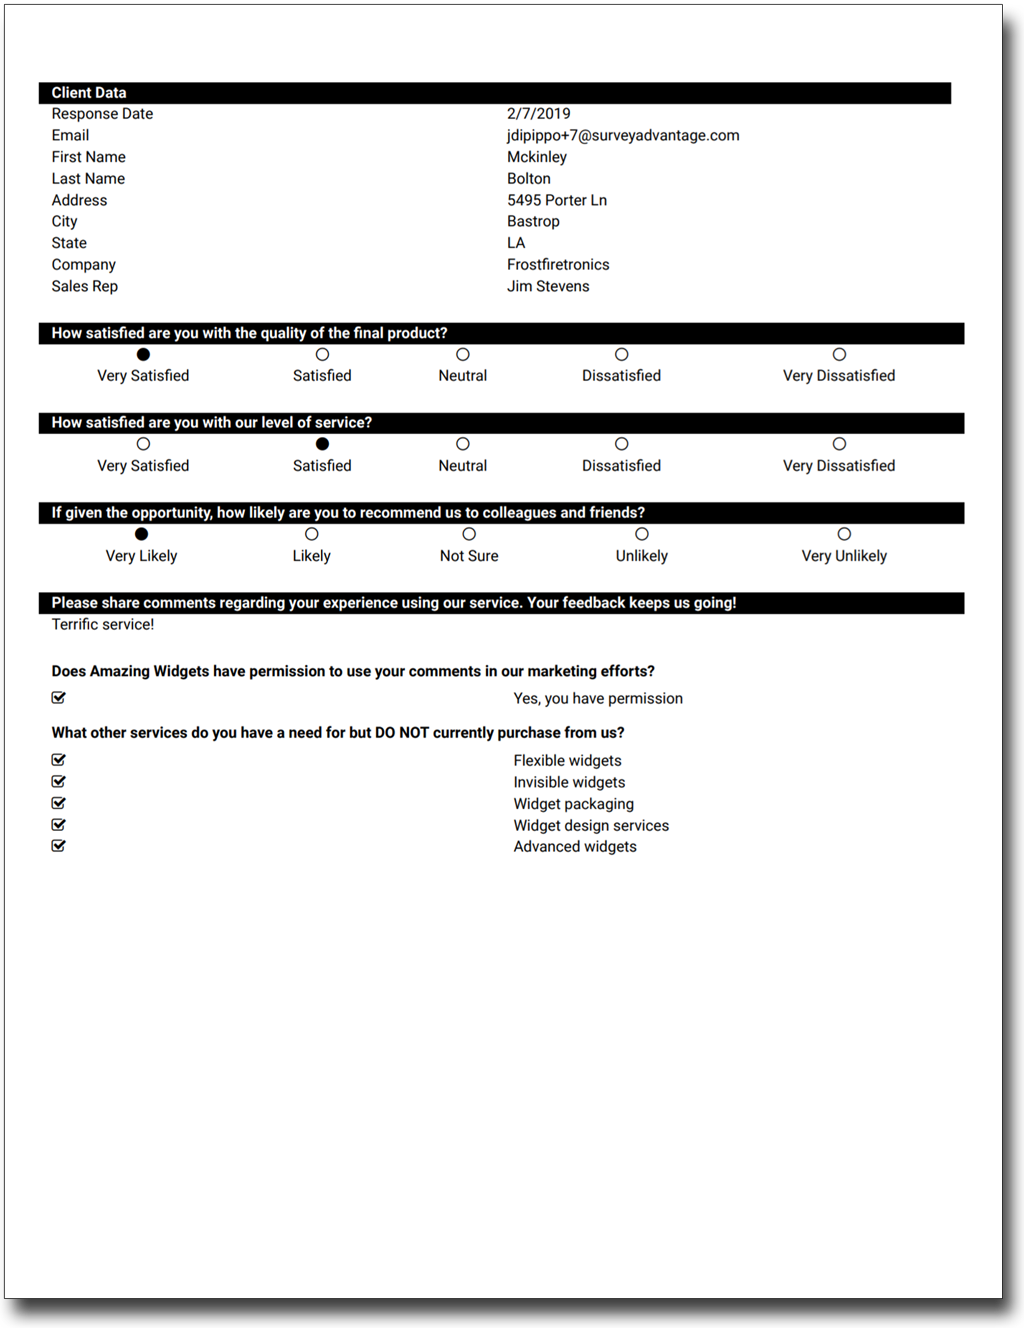
NEW FEATURE: Updated Print Format for Feedback by Customer
By now, you have probably used the print feature to print one or more customer responses. This month we’ve updated the appearance of that report to make it even better.
To print a customer’s feedback go to Feedback by Customer, and either (1) select one or more customers from the table by clicking the checkbox next to the customer’s feedback you wish to print, and click the print icon above the table. All selected customer feedback will print. Note the system will only allow up to 100 customers to be selected and printed at a time; or (2) click on the individual customer feedback from the table in the right (turning the row yellow) to view the customer’s detailed response in the right panel, then click the print icon above the right panel.
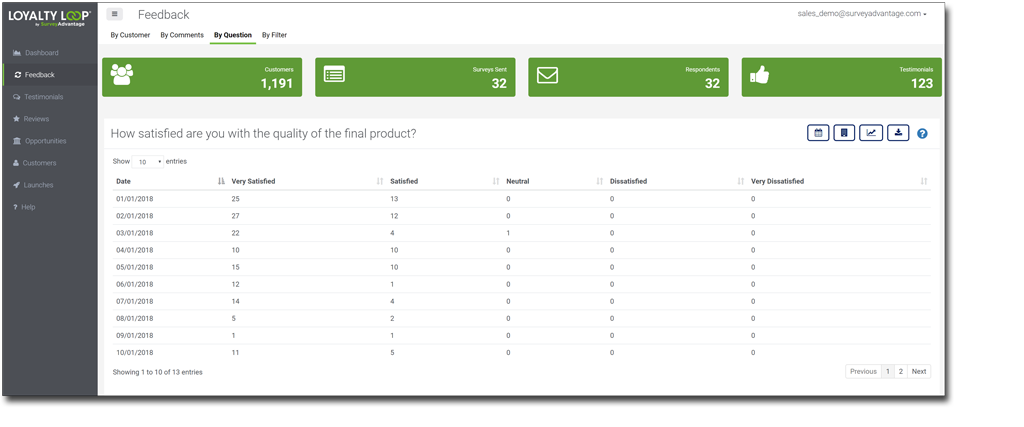
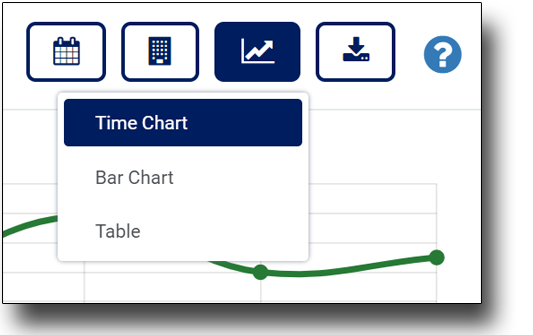
NEW FEATURE: Additional Charting Options for Feedback by Question
On the Feedback by Question view, you’ll see a chart icon above each chart. By default, each survey question is display on a time series chart, however you can select a bar chart, or even the table view of the underlying data.
Simply click the Chart Icon and choose the chart type you wish to display. In certain cases, it's helpful to view your chart as a time series (Time Chart) or as a Bar Chart. The Table view helps you view all the underlying data for the chart.
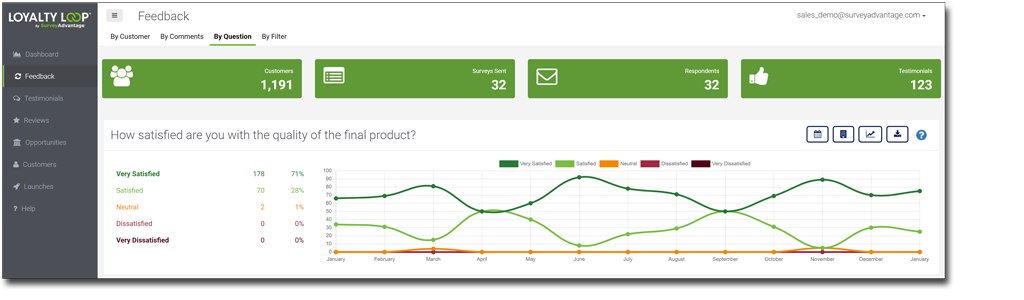
Feedback by Question - Time Chart (default)
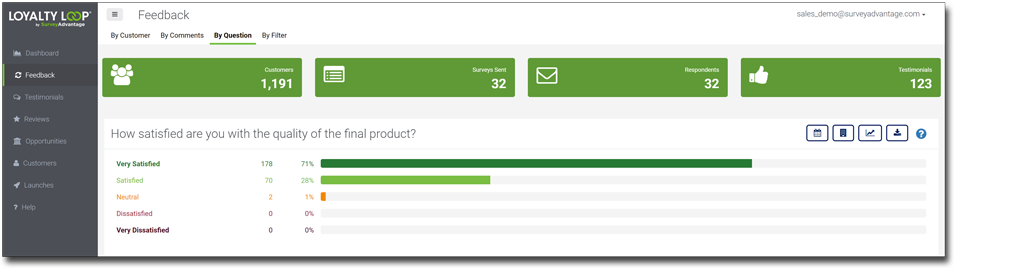
Feedback by Question - Bar Chart
Feedback by Question - Table view