"LoyaltyLoop has been a great tool for obtaining measurable data about our customer's experience with us. It helps me increase customer retention by sending thank you notes to customers that take the time to complete our survey, plus it helps increase sales by following up if they selected services that we offer that they would like to know more about. Plus, the dashboard is super easy to understand."
A Customer Experience Dashboard That Turns Feedback Into Action
LoyaltyLoop® gives business owners, franchise marketers, and operations leaders one clear view of customer feedback and CX metrics. You see what is working, who needs attention, and what to do next. Our team keeps the program running.
Proof at a glance
- 4.7 out of 5 from 4,767 feedback responses
- Typical customer lifetime of 8–10 years
- Licensee and supporter of the Net Promoter System
- We handle setup and ongoing management
What is a customer experience dashboard?
A customer experience dashboard is a single reporting view for customer feedback, CX metrics, and survey results. You track trends and act without hunting through spreadsheets.
Most teams already collect some feedback. The hard part is knowing what it means Monday morning.
A strong CX dashboard surfaces scores, comments, and movement over time. Operators can use it without a steep learning curve.
CX dashboard metrics that matter
A CX dashboard is a view of how customers feel about their interactions. Teams usually pair NPS®, CSAT, and CES with support signals. Customer experience dashboards put experience data and patterns in one place your team can act on.
A useful customer experience dashboard typically tracks:
- NPS®, CSAT, CES, and related CX scores over time
- Survey results, comments, and response rates
- Trends by question, rep, region, product line, or account
- Public signals such as Google reviews beside internal feedback
- Clear next steps when scores move or a customer needs follow-up
How teams usually build the view
- Pick the decisions the dashboard must support, not a vanity metric list.
- Connect survey, review, and transaction sources into one reporting layer.
- Show trend lines and segment filters so owners can find the problem fast.
- Tie alerts and follow-up workflows to the same data, or the board stays unread.
LoyaltyLoop's customer experience dashboard is built for owners and operators who need that picture fast. Your metrics, survey results, and action tools live in one place. Our managed team keeps the program current as your business changes.
Why does your CX dashboard matter?
Customer relationships shift every week. A buyer who felt great last month can cool off after one rough job. You may not hear about it until the account is already gone.
Bain & Company found that 80% of organizations believe they deliver a superior customer experience. Only 8% of customers agree. Consistent CX reporting exists to close that gap.
McKinsey reports that customer-centric companies achieve twice the revenue growth of less experience-focused peers. Intention is not the differentiator. Measurement and follow-through are.
A CX dashboard makes sentiment visible while you can still act. You spot trends, see who needs a call, and track whether scores are recovering. You stop learning about problems only after churn.
What does LoyaltyLoop's CX dashboard show you?
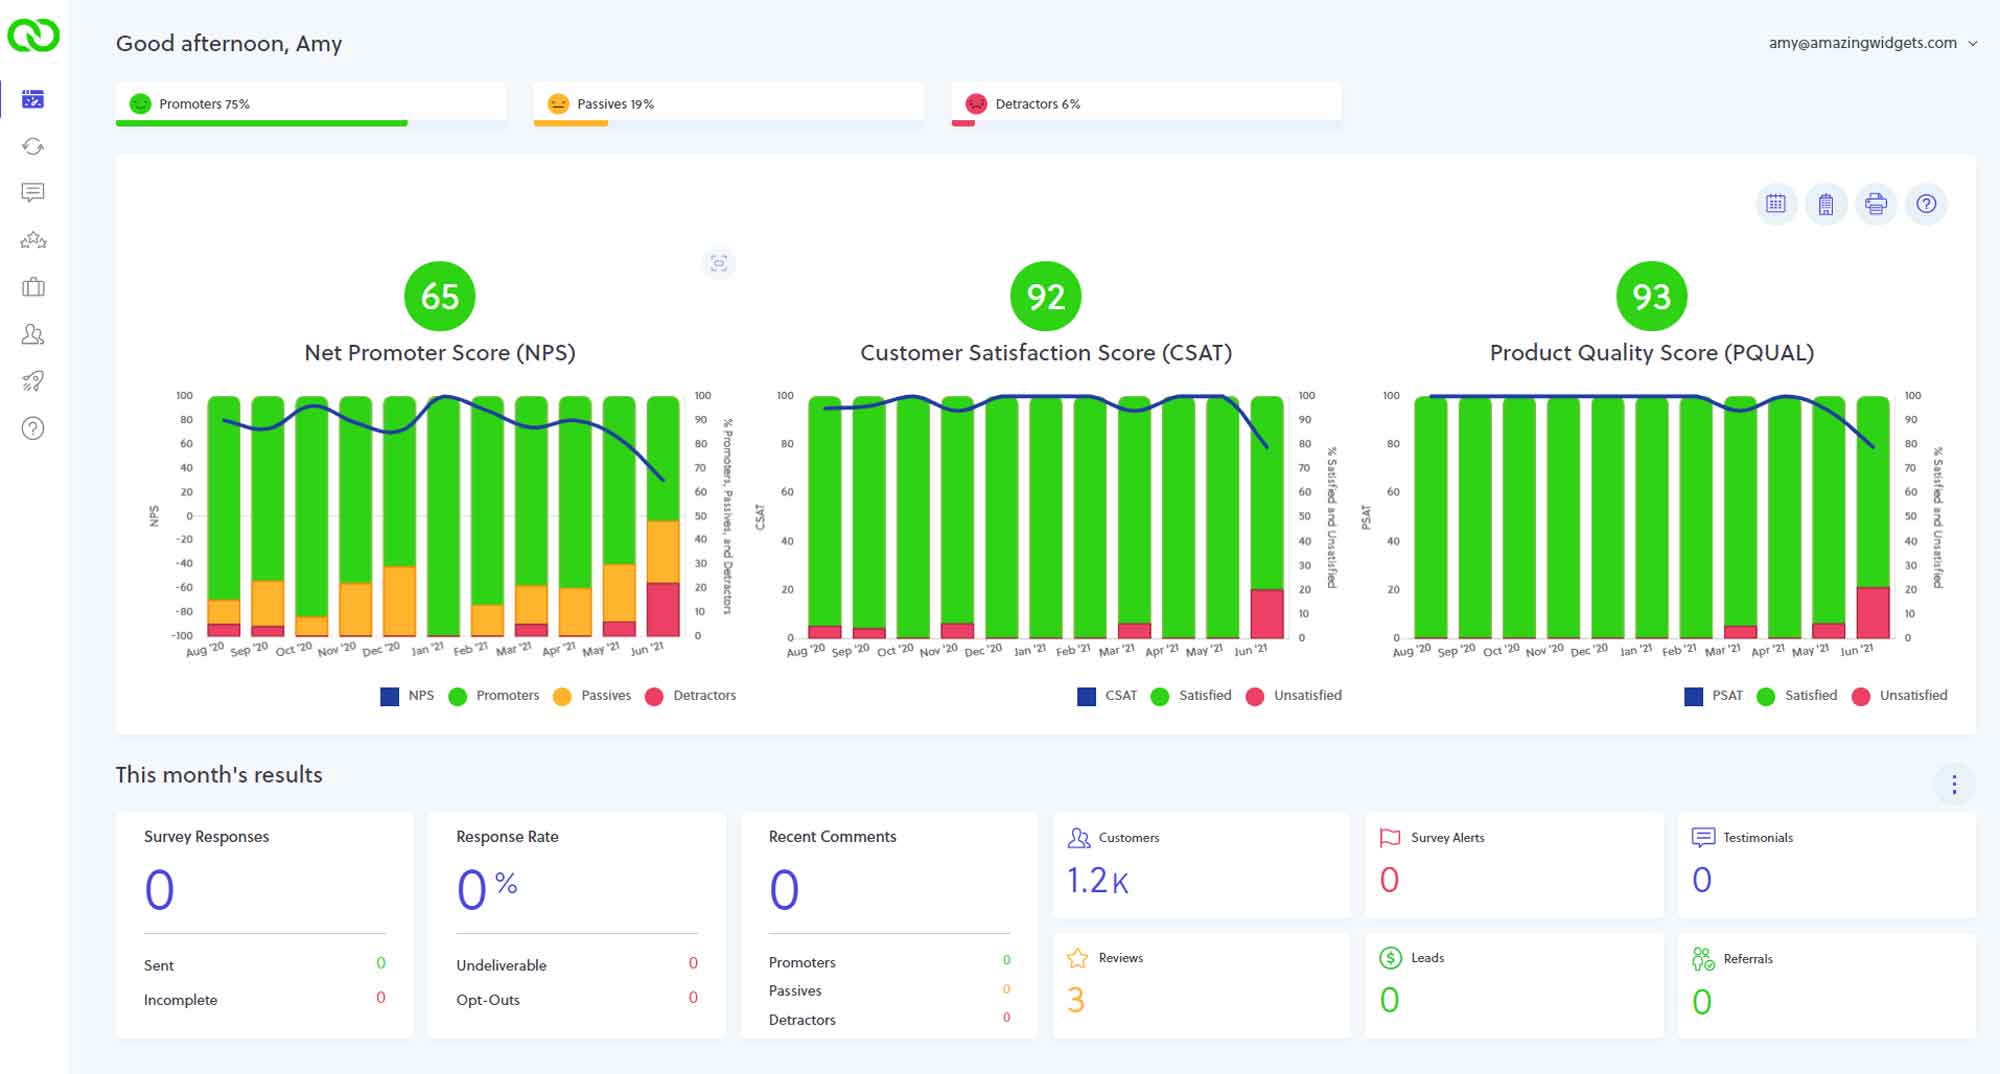
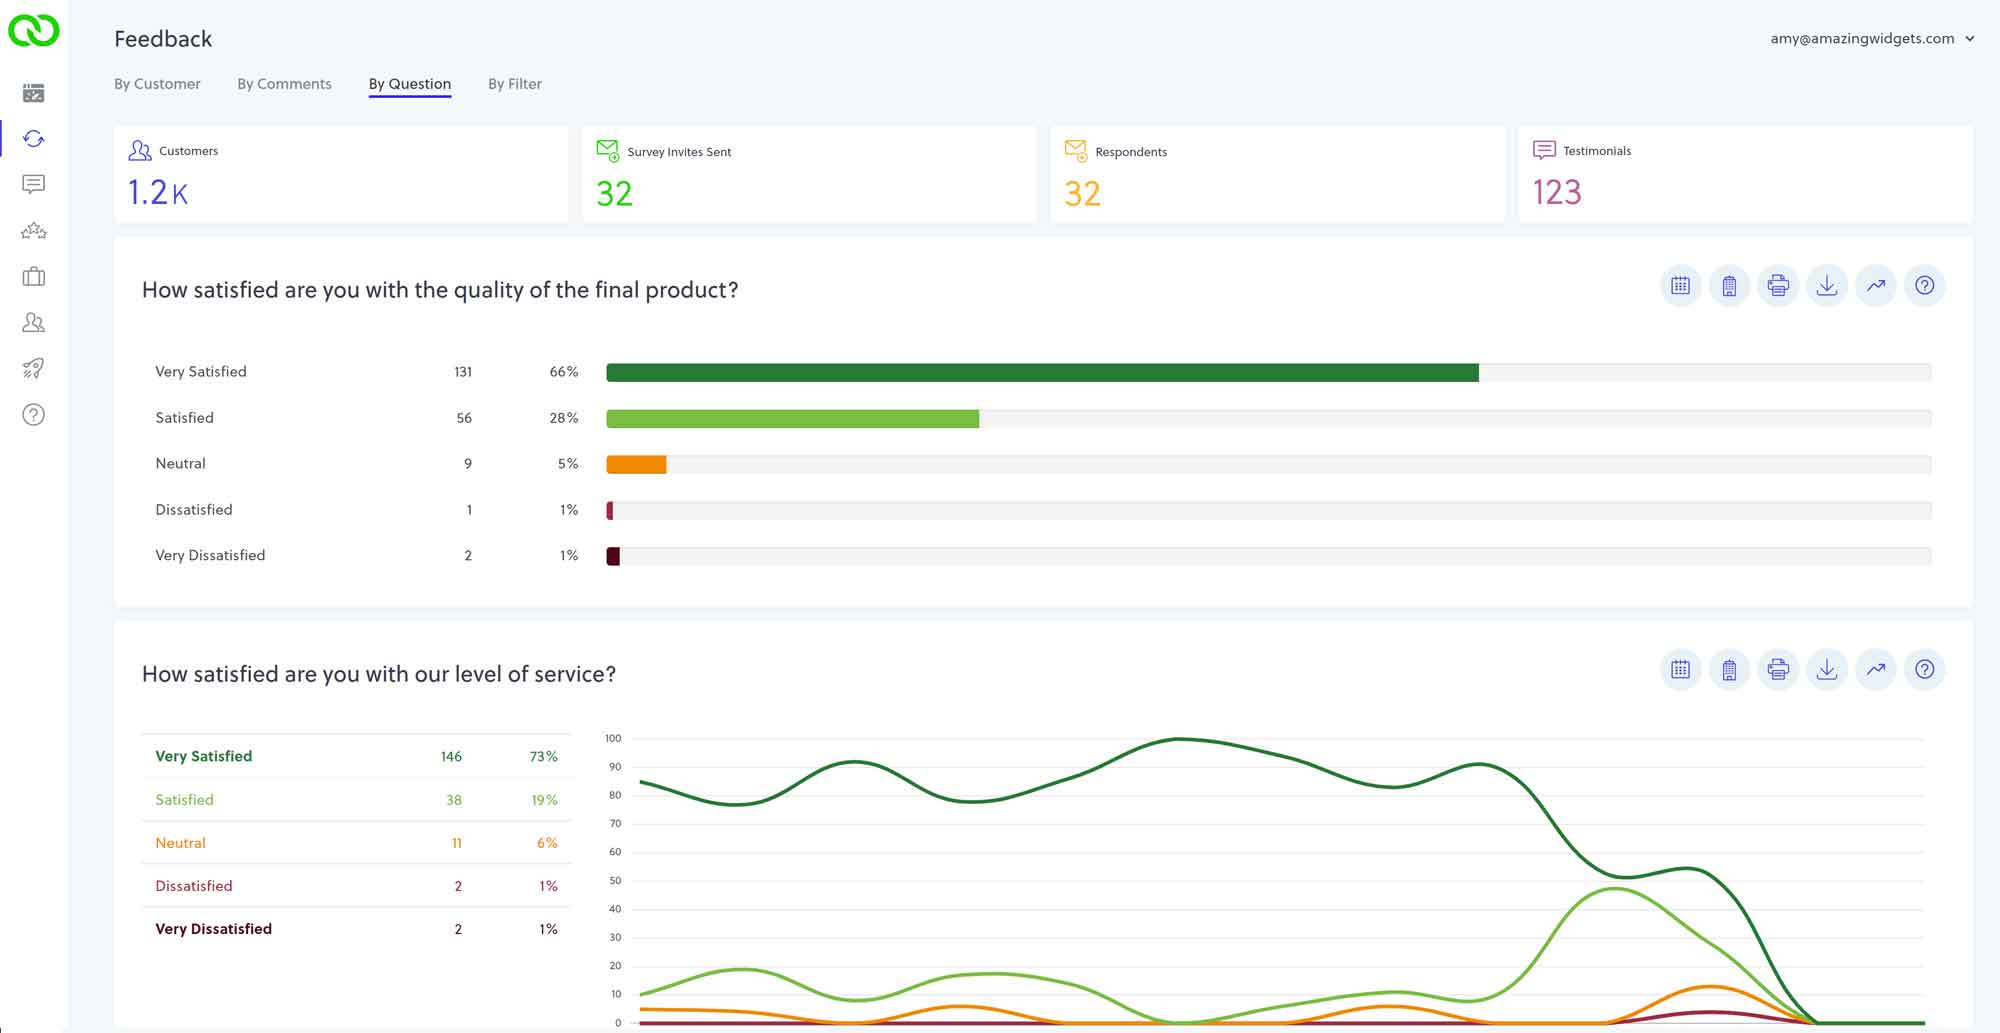
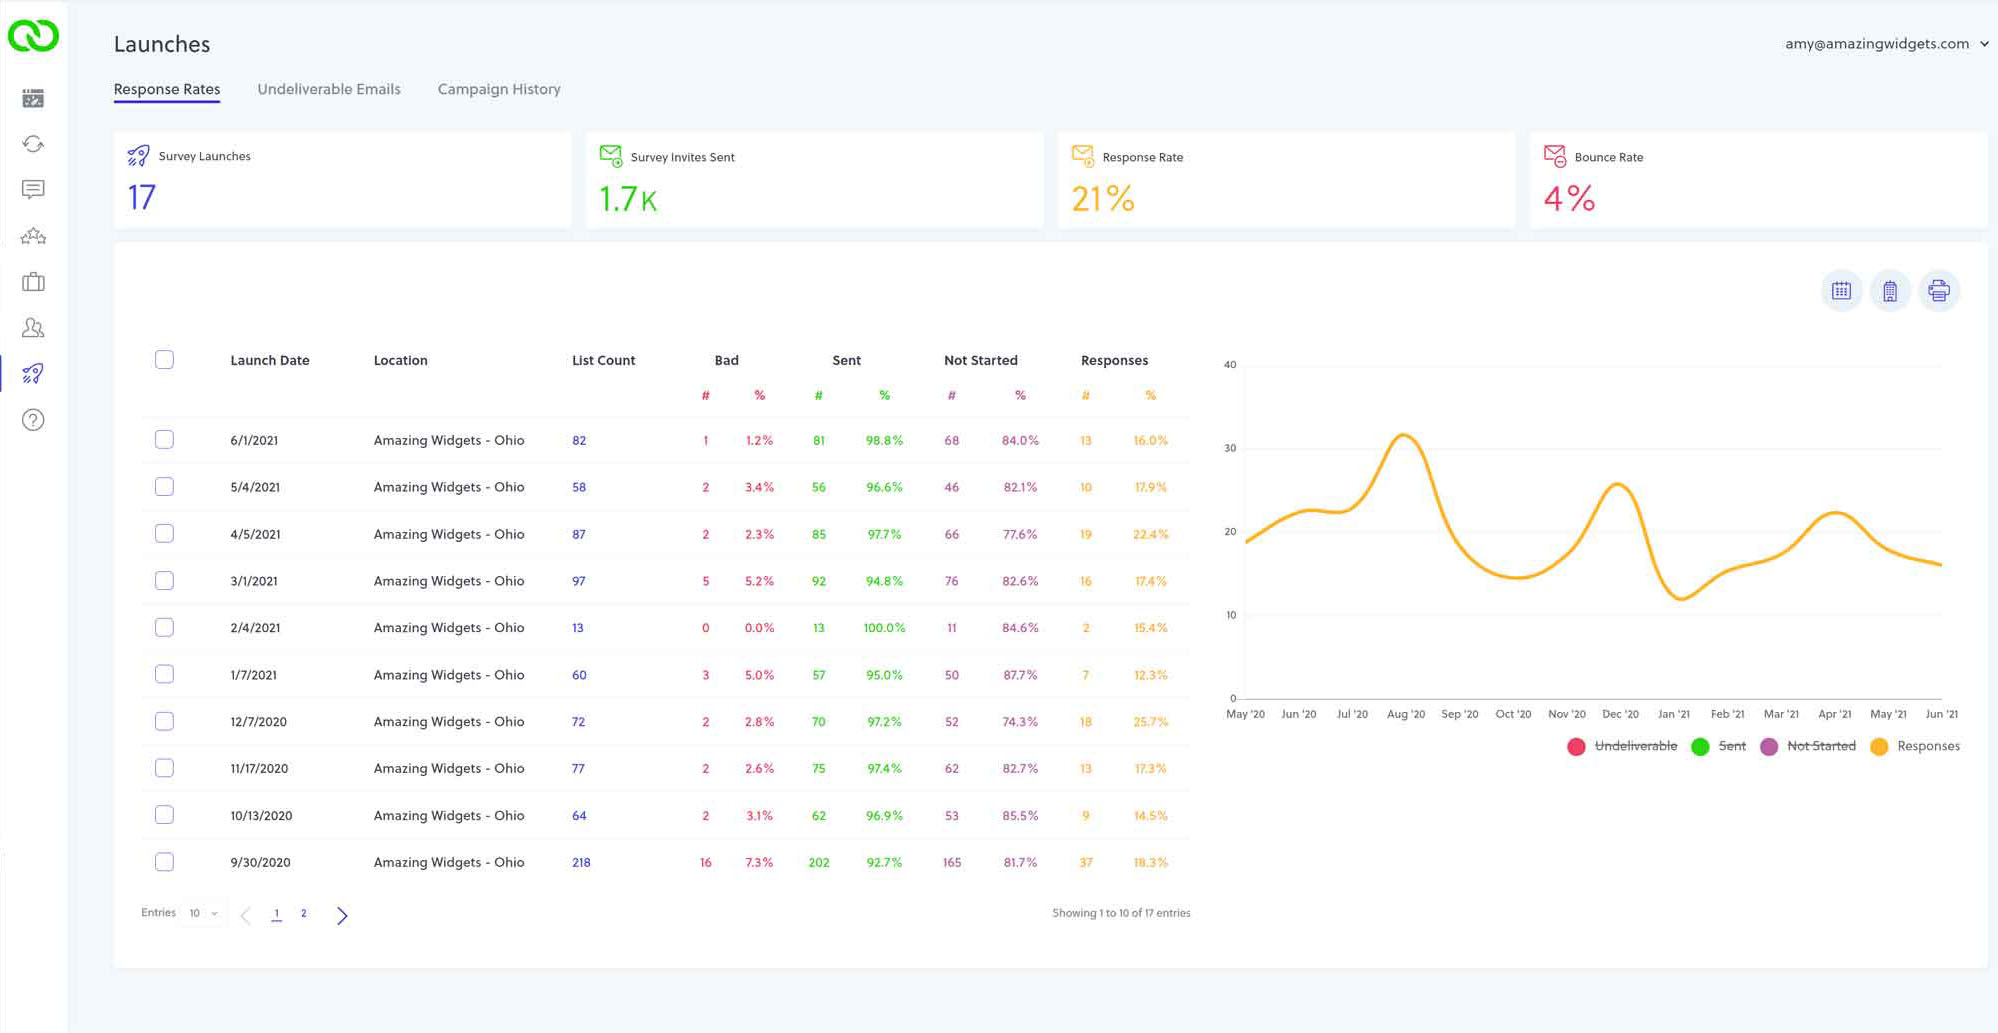
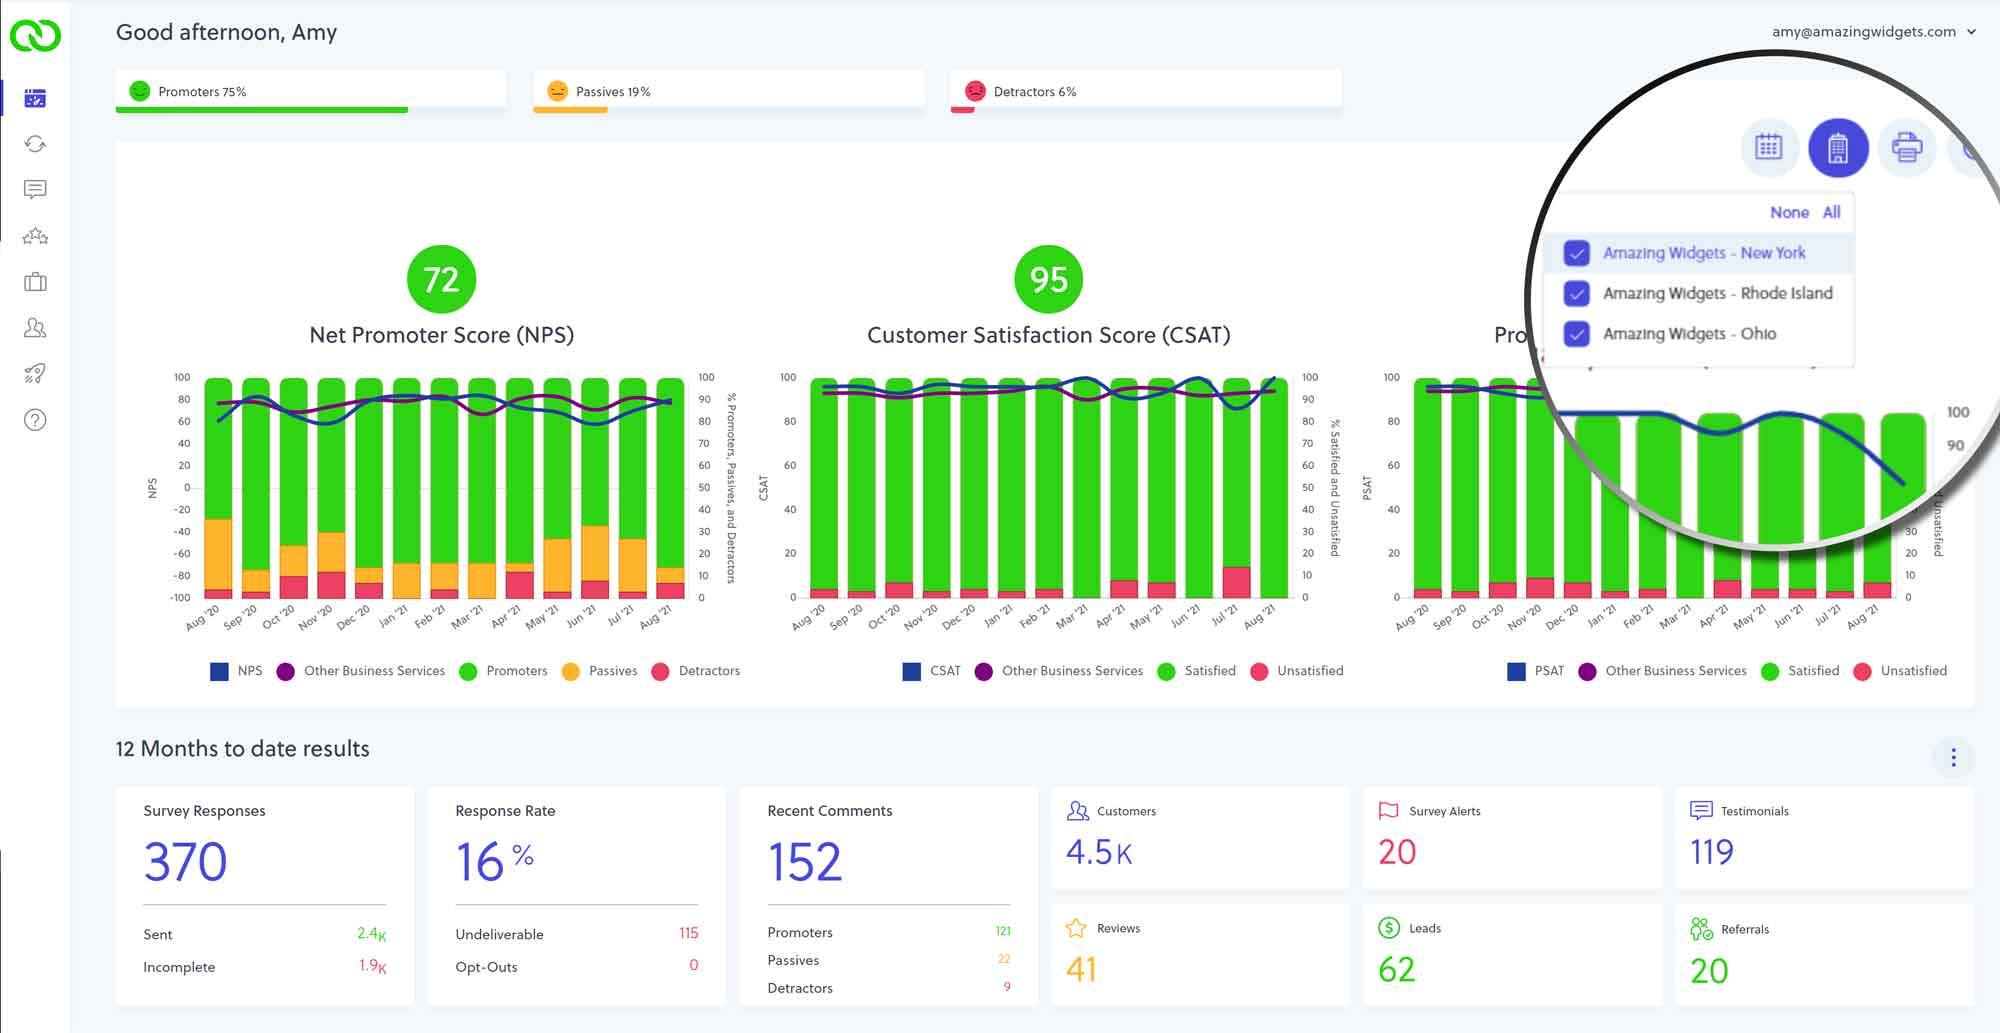
Here’s what you see in LoyaltyLoop's customer feedback dashboard. Each view supports a clear decision:
CX metrics in one dashboard view. Track NPS®, CSAT, CES, and related quality scores over time.
Survey results and response data. See answers, comments, and response rates across launches.
Individual customer views. Open one customer's feedback history and satisfaction trend before the account is lost.
Feedback by question and trend lines. Watch each survey question shift as sentiment starts to move.
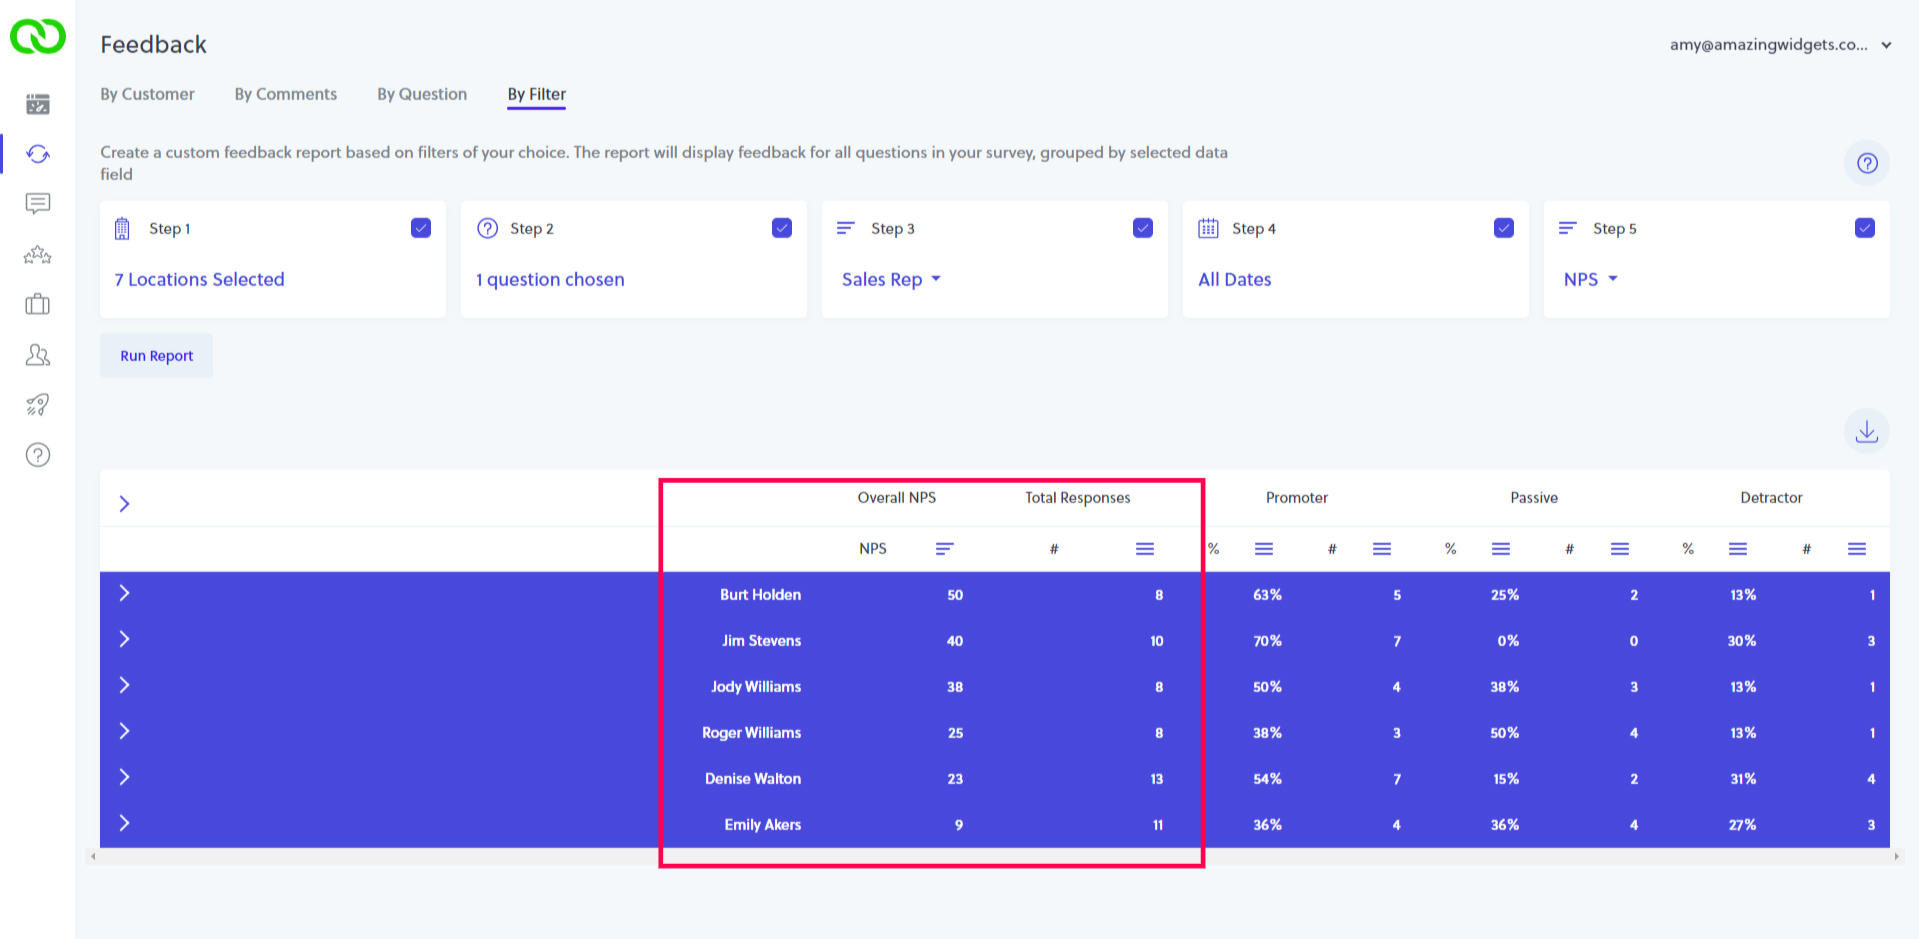
Filtering for CX reporting. Slice metrics by rep, region, product line, or account.
Google Reviews and testimonial activity. View public and internal feedback in one place.
Multi-location and Enterprise Dashboard views Roll up the network while each site keeps its own data on advanced plans.
How does LoyaltyLoop turn dashboard data into action?
Seeing your data is only the first step. LoyaltyLoop connects dashboard data to the tools that help you act. When a customer reports a poor experience, a Poor Feedback Alert fires. Your team can follow up before the relationship is at risk.
When dormant accounts cluster in the data, LoyaltyLoop sales tools help you re-engage them automatically. Customers can be prompted for a referral, a Google review, or a testimonial based on your workflow configuration. Your team does not do that work by hand.
LoyaltyLoop's fully managed service means you are not doing this alone. The team helps you interpret the dashboard and keeps your program adjusted as you grow.
How does LoyaltyLoop's CX dashboard work for multi-location businesses?
You can see the full network without losing location-level control. Multi-location teams need shared visibility and local ownership together. Without both, feedback stays siloed and gaps stay hidden.
LoyaltyLoop gives each location its own feedback data, isolated and accessible on its own. You control which teammates see which sites.
You publish testimonials to the right website. You route Google review requests to the correct profile for each location.
For brand leadership, the Enterprise Dashboard rolls every location into one view. You spot underperforming sites, track brand-level trends, and coach from shared data without manual reports.
Regional managers and field coaches work in the same system with role-based access. For franchise networks, we configure access around your franchisee relationship so leadership can reach each location's CX dashboard when that structure is required.
See your customer experience dashboard on a live walkthrough
Schedule a short demo and we will walk through LoyaltyLoop's customer experience dashboard with your workflows in mind. You’ll see metrics, survey results, and next actions.
We handle setup and ongoing management. No long-term contract.
Schedule a Demo
Frequently Asked Questions About Customer Experience Dashboards
Treat a score drop as a signal to act, not a number to defend. Start with comments and filters. See whether the change ties to a rep, location, product line, or time window. Then follow up with affected customers and watch whether scores recover.
LoyaltyLoop's filtering tools help you isolate where the change is happening so you respond to the right problem. From there, your team can adjust the process and keep monitoring. Our fully managed service team can help you interpret shifts and recommend program changes.
Contact and transaction data flow in from your systems or simple uploads. Surveys go out after transactions at a sensible frequency. Responses land in your dashboard automatically. You do not need a full-time analyst.
LoyaltyLoop offers integrations that pull contact and transaction data. Surveys fire at the right time without over-touching customers.
When customers respond, feedback feeds the dashboard directly. Without a direct integration, upload contacts through reporting exports or a dedicated inbound email address. Either path keeps customer experience monitoring current.
An alert asks someone to act right away. A notification keeps the team informed on a schedule. In LoyaltyLoop, a Poor Feedback Alert fires when feedback signals a poor experience. Your team can follow up while the relationship is still recoverable.
A notification, such as a weekly summary, delivers a digest of feedback activity. People stay informed without logging in every day. Both are configurable, including who receives each type.
Judge scores against your own trend first. Use industry context as a secondary check. NPS® is a continuous improvement tool, not a vanity target to chase for its own sake.
Benchmarks vary by industry. A "strong" number in one sector can be average in another. For directional context, NPS® above 0 is often treated as okay, above 50 as strong, and above 70 as exceptional. Many teams watch CSAT with an internal goal near 80% or higher.
Your trajectory still matters more than a single snapshot. LoyaltyLoop's dashboard tracks scores over time so you can see whether you are improving, holding steady, or slipping.
Yes. You set permission levels and, for multi-location teams, limit access by location.
LoyaltyLoop supports full administrative access for people who manage settings and billing. Read-only access fits teammates who only need feedback and scores. Location-based access keeps each user inside the data that matches their role. That keeps customer data tighter as the team grows.
It surfaces risk early enough for a human follow-up. Most preventable churn shows up in feedback, silence, or score movement first. The account often leaves later.
A CX dashboard highlights trend shifts and flags customers who reported poor experiences. It gives your team a place to act before the relationship is gone.
LoyaltyLoop ties that visibility to action. A Poor Feedback Alert prompts follow-up when experience is poor. LoyaltyLoop sales tools help you re-engage dormant accounts when the data shows silence.
The dashboard is the starting point for keeping more customers, not a report you only open at quarter end.
Start making your customer experience data work for you
Get a clear view of feedback, CX metrics, and survey results. A managed team handles setup and ongoing program work so your operators stay focused on customers.
Schedule a demo and we will walk through the dashboard with your workflows in mind. No long-term contract.
Schedule a Demo