September 2021
The New User Interface
As we announced on September 1, we’ve released the new LoyaltyLoop user interface. Along with that update, we’ve added a number of enhancements for you, with plenty more planned down the road.
Customer Experience Charts
On your Dashboard, you'll now see up to 3 customer experience (CX) charts, depending which CX questions you’ve chosen to include in your survey. At a minimum, and consistent with the prior user interface, you'll see your Net Promoter ScoreSM (NPS®) chart. However, you may also see charts with metrics and trends for your Customer Satisfaction Score (CSAT) and your Product Quality Scores (PQUAL).
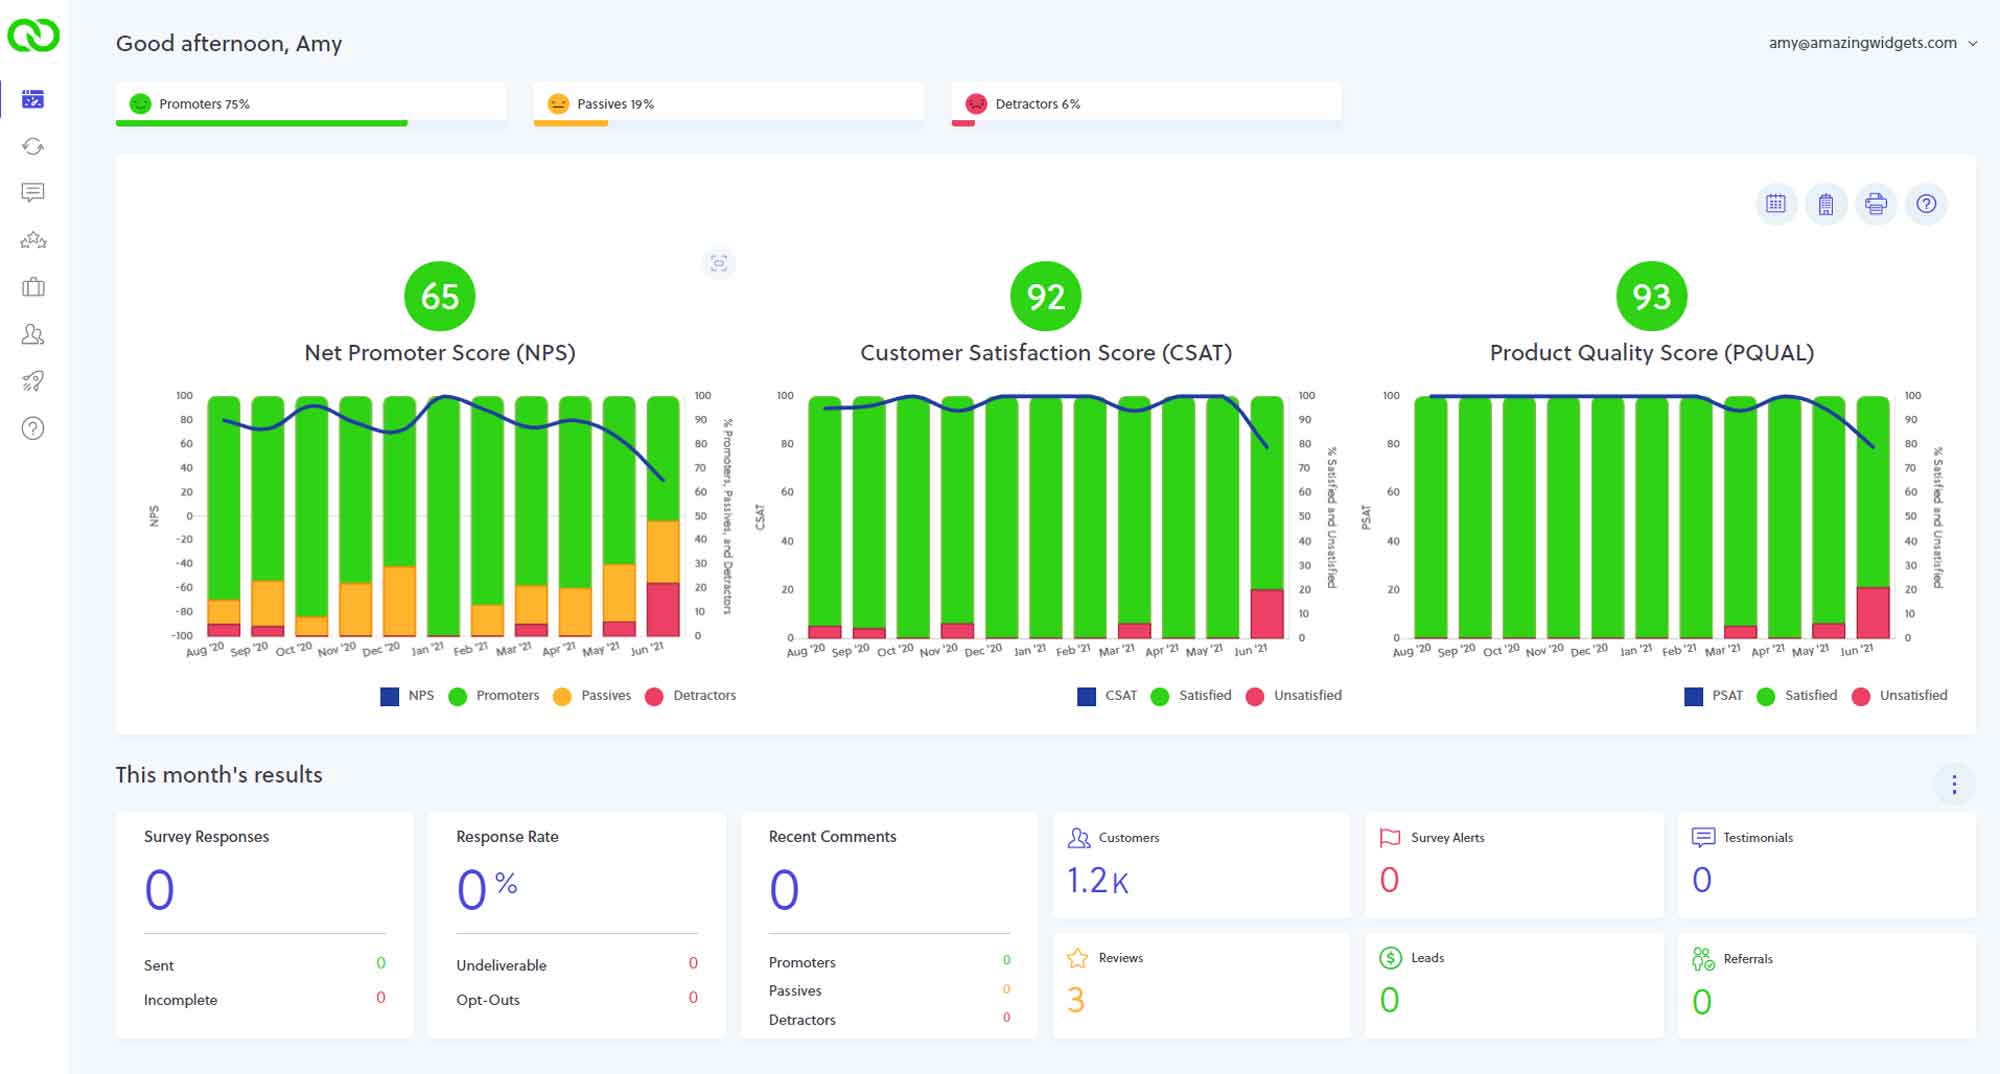
When more than one chart is displayed, hovering over a chart will reveal a "maximize chart" icon. Clicking it expands the chart to fill the screen, and you can step through each chart using the left/right arrows, or click "minimize chart" to show all the charts again. These additional charts and metrics help you to more deeply understand how your customers view your business.

Dashboard Widget Date Range
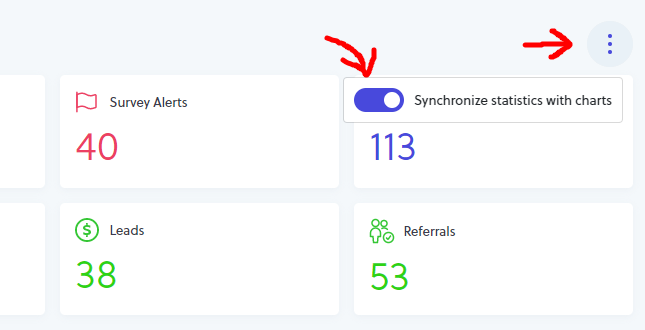
The summary widgets at the bottom of your Dashboard previously displayed "This Month's" results only, for all locations. Now, you can set the widgets to use the selections in the CX chart section above - both date range and locations. By default, the widget date range is still set for "This Month" and all locations as in the previous UI, however if you set the switch to use the chart selections, LoyaltyLoop will remember this setting when you sign in again. This feature allows for easier comparison of results between the widget metrics and your CX charts.
Enhanced Mobile Experience
Using software applications on narrow devices like phones can be tricky, particularly when tables are used to display columns of data. With the release of the new user interface, we've greatly enhanced your mobile experience in many ways. One of the biggest mobile enhancements is the ability to cleanly view tables on phones.
All the major table views in LoyaltyLoop display tables in a clean manner, fitting neatly in the narrow screen, and without horizontal scroll bars. This is accomplished by presenting the minimal columns that fit within your narrow phone screen, and providing a button that allows to you expand that row to reveal the underlying columns. Also, clicking on a row in the tables will pop-up the results in a separate view. These major mobile enhancements make viewing your results, and taking action like publishing testimonials, from your phone much easier.
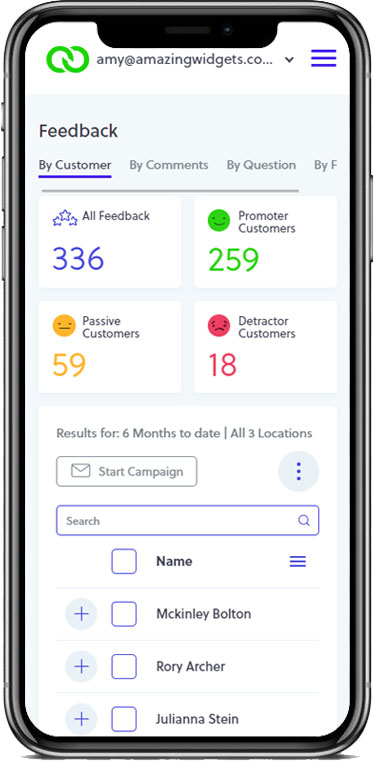
The above image shows how Feedback by Customer appears on a phone. Everything fits on the narrow screen. Your date picker and other pickers are found under the 3-vertical dot icon, and rows in tables can be expanded by clicking the plus (+) button.
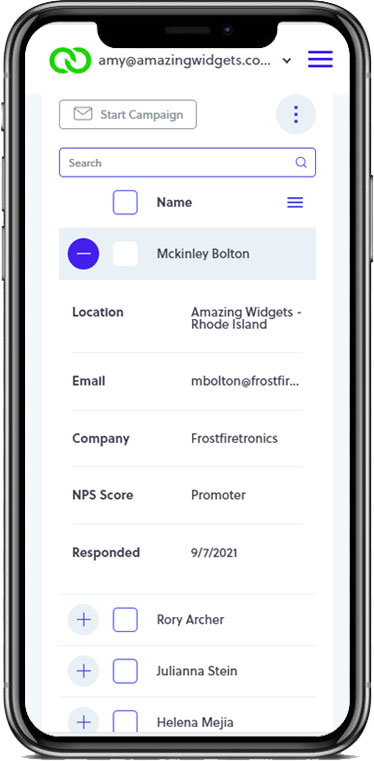
When clicking the plus (+) button next to a customer, the row expands to show the additional columns in the table. Again, everything fits neatly on narrow devices like your phone. Clicking the minus (-) button collapses the row again.
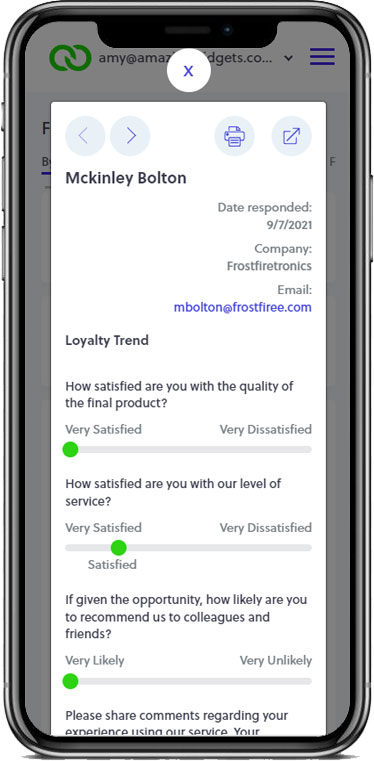
When clicking on the entire customer row, a pop-up will display the customer's entire survey response formatted for your phone. Clicking the X at the top will close the pop-up.
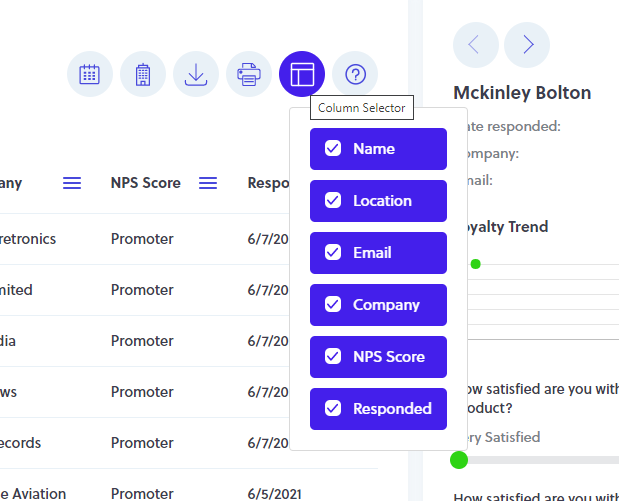
Customize Table Columns
On all major tables throughout the application, you'll now find a new control allowing you to customize the columns displayed. This helps isolate only the data that matters to you.
Printable Charts
All charts can now be printed. Simply click the print icon above the chart, and the chart or charts will be formatted for printing.
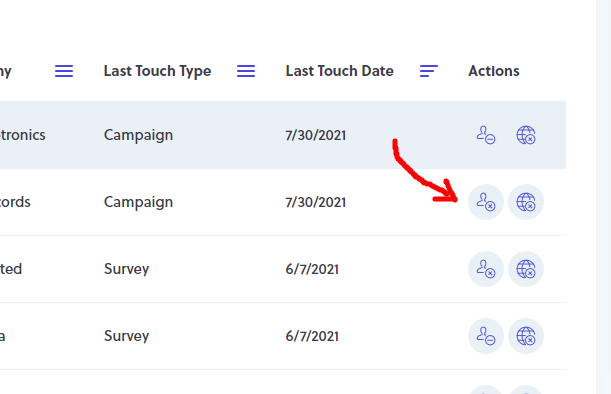
Easier Opt-Out Method
To opt-out a customer from receiving your survey or emails, you now have a quick and simple way to accomplish this. Go to your Customers tab, and notice the 2 new icons under the Actions column. Clicking the icon on the left opt-outs that one customer, and clicking the icon on the right opt-outs all customers where their email address matches the domain name of this contact. Simple.
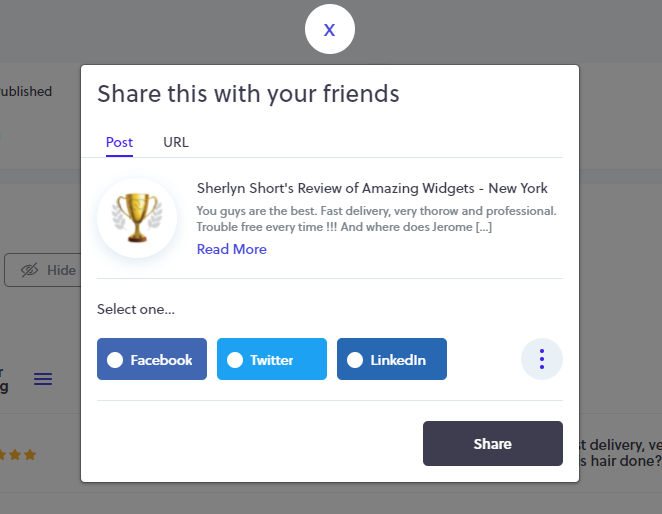
Sharing Testimonials on Social Channels
We've updated and simplified sharing any published customer testimonial on your social channels. On the Testimonials tab, click the share icon under the Actions column next to the testimonial you wish to share. You'll see the pop-up shown here, allowing you to share the testimonial on the top social channels, or you can copy the URL to the published testimonial to share it in email and other messenger applications. What a great way to amplify why customers love doing business with you!
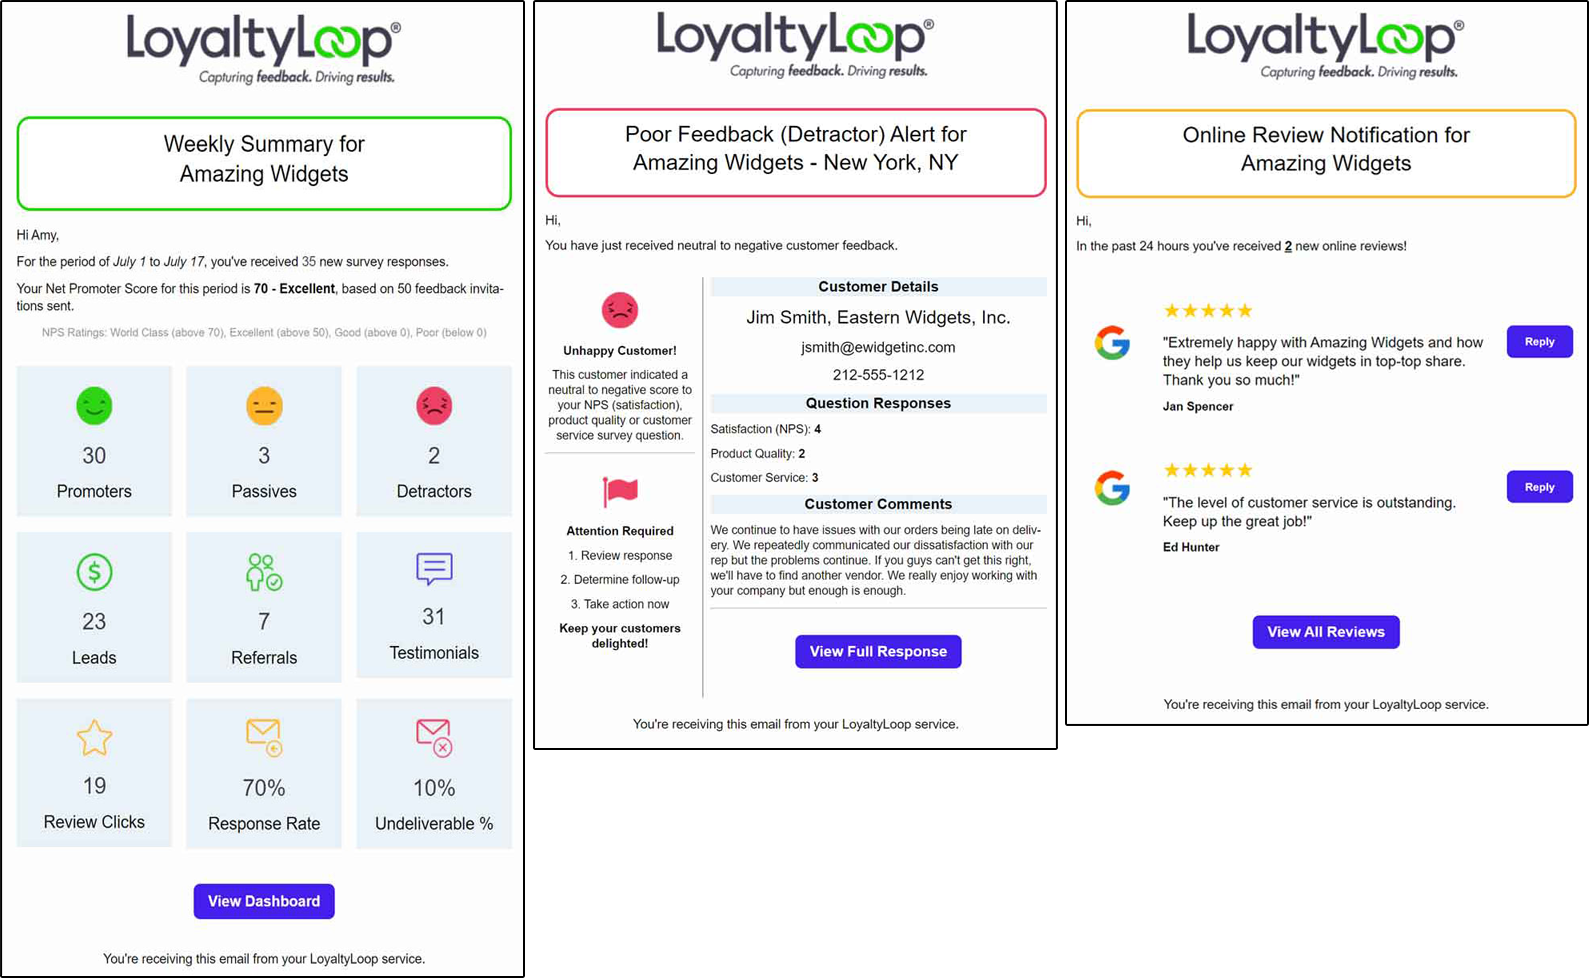
Refreshed Email Alerts and Notifications
All email alerts and notifications have been updated to reflect the new user interface design theme including colors and icons.
Horizontal Testimonial Widget Options
When using the Horizontal Testimonial Widget, you can now set the number of testimonials that will display per horizontal page (from 1 to 8), and choose to use either full page navigation (showing the number of pages) or a minimal page navigation (showing a back and next button).
Maximizing Customer Reviews
Part 6: Choosing Which Customer Review Platforms to Use for Your Business
As a business, your time and resources are limited so you have to be intentional about which review platforms you target for your business. According to ReadyCloud, 59% of consumers scout reviews from 2-3 different review sites before buying, so you should not put all your eggs in one review-collecting basket.
As a baseline, you generally have to invest in collecting Google customer reviews and Facebook customer reviews. Because these are some of the most common places for customer review gathering for all industries. After these, it depends on your industry. There are generally two categories of customer review websites: generic sites for any product or service (think Google or Facebook) and industry specific sites (think WebMD or Expedia).
For example, restaurateurs may discover that customer review websites such as Yelp and TripAdvisor are best for their industry. Common sites for medical reviews are Healthgrades.com, WebMD, and Vitals.com. Many homeowners search for contractors on Home Advisor (now part of Angi), or Angi (previously Angie’s List). Angi aggregates businesses and services based on specific home projects. They match customers with contractors based on project scope, timing, and location.
Each industry is different so you will have to do your homework and find out where your customers are looking. Make sure to do your research and give preference to review websites that verify customer transactions before they can leave a review. Potential customers look for this when reading reviews to gauge their authenticity.

Photo by Chris Liverani on Unsplash
Once you have chosen which platforms you are going to pursue, “make sure you’ve already set the foundation in place by creating profiles on [these] review sites. Include direct links to the profiles in multiple places. Your website, newsletter and follow-up emails are prime locations” (GoDaddy).
Popular review websites include:

‘Wisdom of the Crowd’
A recent TripAdvisor study polled over 23,000 TripAdvisor users across 12 markets on the use of online reviews and their role when booking hotels, restaurants and experiences. The study reveals that the wisdom of the crowd remains the reason respondents visit TripAdvisor, with participating users citing the descriptive and helpful reviews (70%), the accuracy of the content (62%) and the broad range of travel content (62%) as their primary reasons for visiting the site.
Across hotel, restaurant and attraction reviews, more than four out of five (85%) participants report that the reviews they read on TripAdvisor accurately reflect their experience, with 86% agreeing that TripAdvisor makes them feel more confident in their booking decisions.
Nearly 8 out of 10 TripAdvisor users (79%) are more likely to book a hotel with a higher bubble rating when choosing between two otherwise identical properties, and over half (52%) agree that they would never book a hotel with no reviews. (Source: TripAdvisor - Online Reviews Remain a Trusted Source of Information When Booking Trips, Reveals New Research)
Maximizing Customer Reviews
Part 7: Maximizing Google Reviews for Your Business
The elephant in the room.
Let’s face it, Google is the current kingmaker in the world of online search and customer reviews. In 2020, Alphabet Inc, (Google’s parent company) had a revenue of over $180 billion and shows no signs of slowing any time soon. It’s hard to wrap your brain around everything Alphabet/Google controls. Gmail, Google Maps, Google Cloud, not to mention the 129 million current Android phone users - just to name a few. Add to that YouTube (which is a monster search engine itself) and the $40 billion advertisers spend on Google Ads (Forbes).
How big is Google in the online review game?
Google is truly the elephant in the room in online customer reviews. It is the most popular online review platform and 57% of consumers use it to read reviews. It hasn’t always been this way. Other review platforms used to have a much higher share of the market, especially Yelp. Over time, each platform has made strategic decisions about who can write reviews and how to ask people to write them. In the end, Google’s bets paid off and the others, not so much. According to Near Media, Google started taking off in 2014 and quickly overtook Yelp.
Near Media - Average Annual Review Corpus Growth Rate (2014 - 2020)
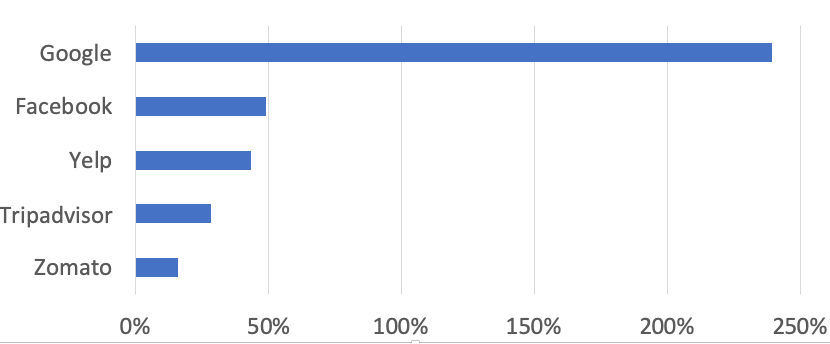

Photo by Alban from Japan on Unsplash
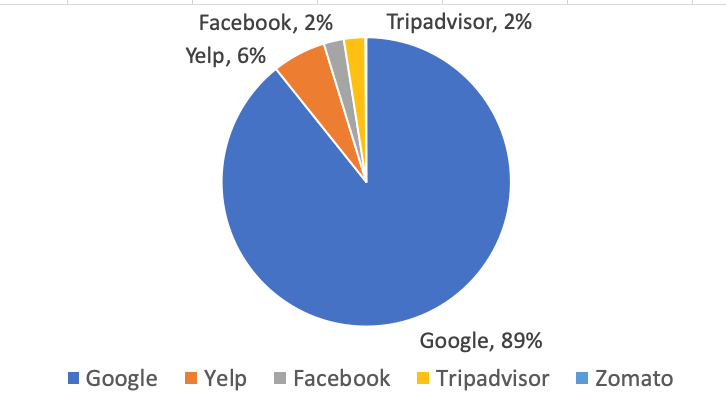
Near Media says, “Google's efforts in 2015 and 2016 laid the groundwork for the hyper growth we saw starting in 2016. This has left Google with an arguably insurmountable lead in restaurant reviews. If you examine just the past few years Google's lead in total reviews looks even more daunting, with an 89% total share to Yelp's declining 6% share.”
Near Media - Review distribution 2018-2020 for a mid-sized restaurant chain
Why Google Reviews are Important Your Business
Ideally, your potential customers would only interact with your business directly so you can manage the interaction, such as on your website, social media, and of-course, your physical or online store. However, customers will instead often search for your industry or product category on a search engine (likely Google).
When someone searches for your industry or product, you want your business to show up as high as possible in the native search results (the results after the paid ones at the very top of the page). In order to show up at the top, it is important to make sure you are optimizing your website for Google to find and recommend you. This is called Search Engine Optimization (SEO).
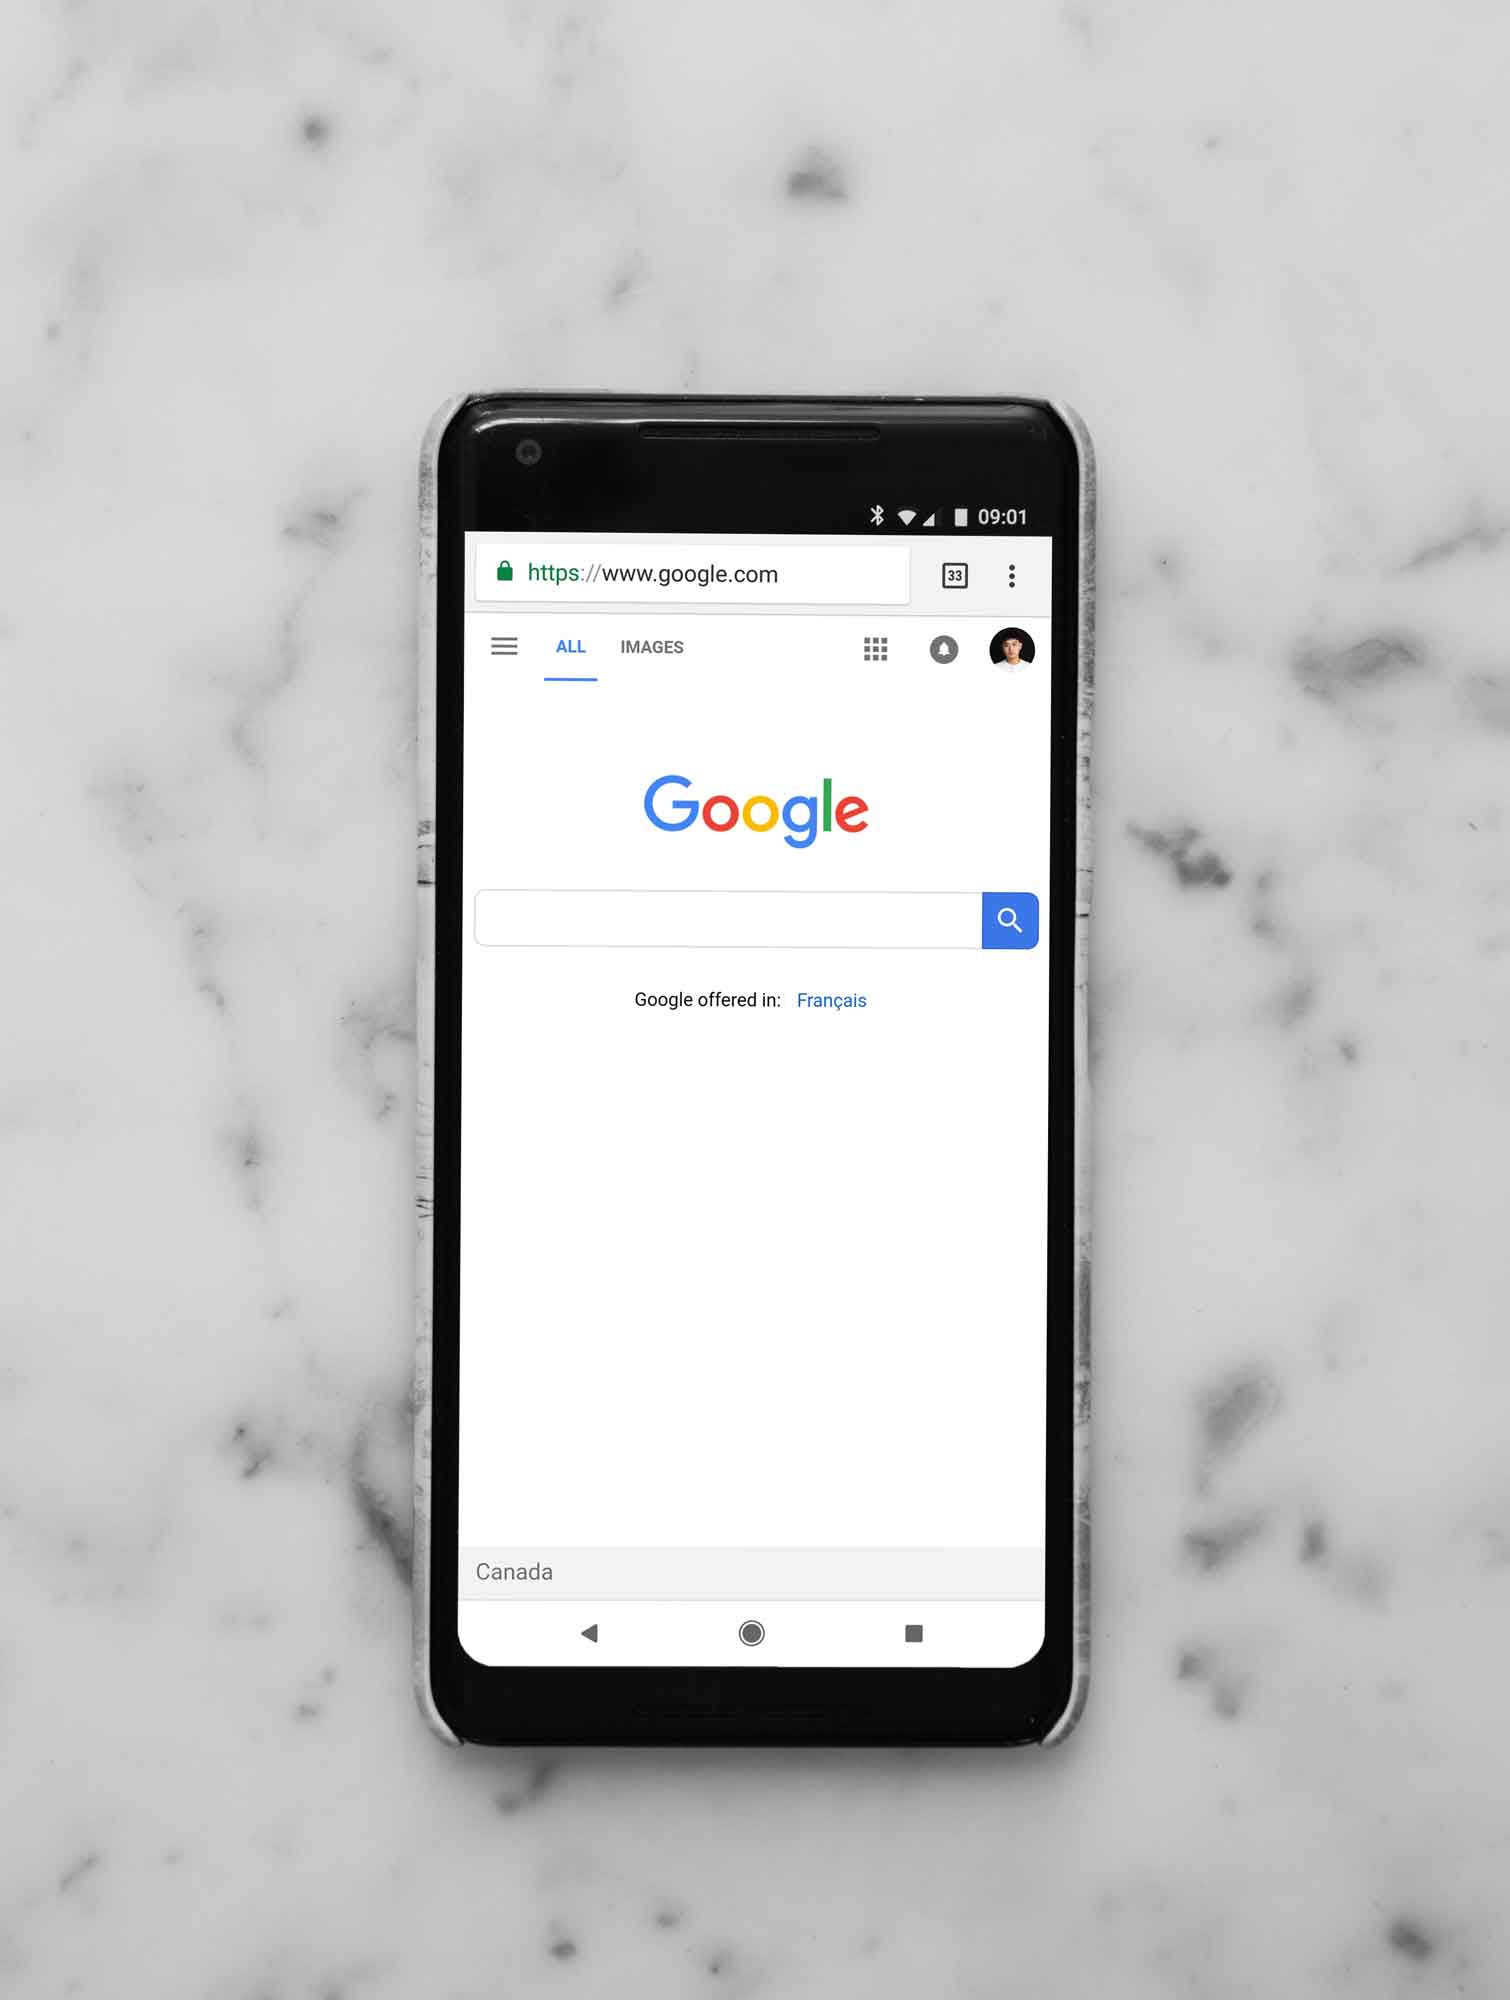
Photo by Charles Deluvio on Unsplash
Google Reviews and SEO
So how do you leverage Google My Business reviews and SEO to your benefit? Google gives ranking preference to companies who actively interact with Google. One way to indicate to Google that you should appear high in the results is to utilize your Google My Business page. Provided for free by Google, Google My Business is a free tool that allows you to promote your Business Profile and business website on Google Search and Maps. With your Google My Business account, you can see and connect with your customers, post updates to your Business Profile, and see how customers are interacting with your business on Google.
Encouraging your customers to promote your business via Google reviews will help you show up higher in native search results.
Understanding Customer Experience (CX) Metrics

Photo by Patricia Serna on Unsplash
On any normal day, your customer makes a purchase decision and engages in a transaction with you; you provide a service and/or a product with a smile, and the customer pays. Everyone’s happy. Or are they? To understand your customer’s experience (CX) you must engage them in a feedback process of some kind so it can be measured. After all, if you’re not measuring, you’re guessing.
LoyaltyLoop helps you track CX metrics so you can ensure your customers are having the best experience possible when interacting with your company.
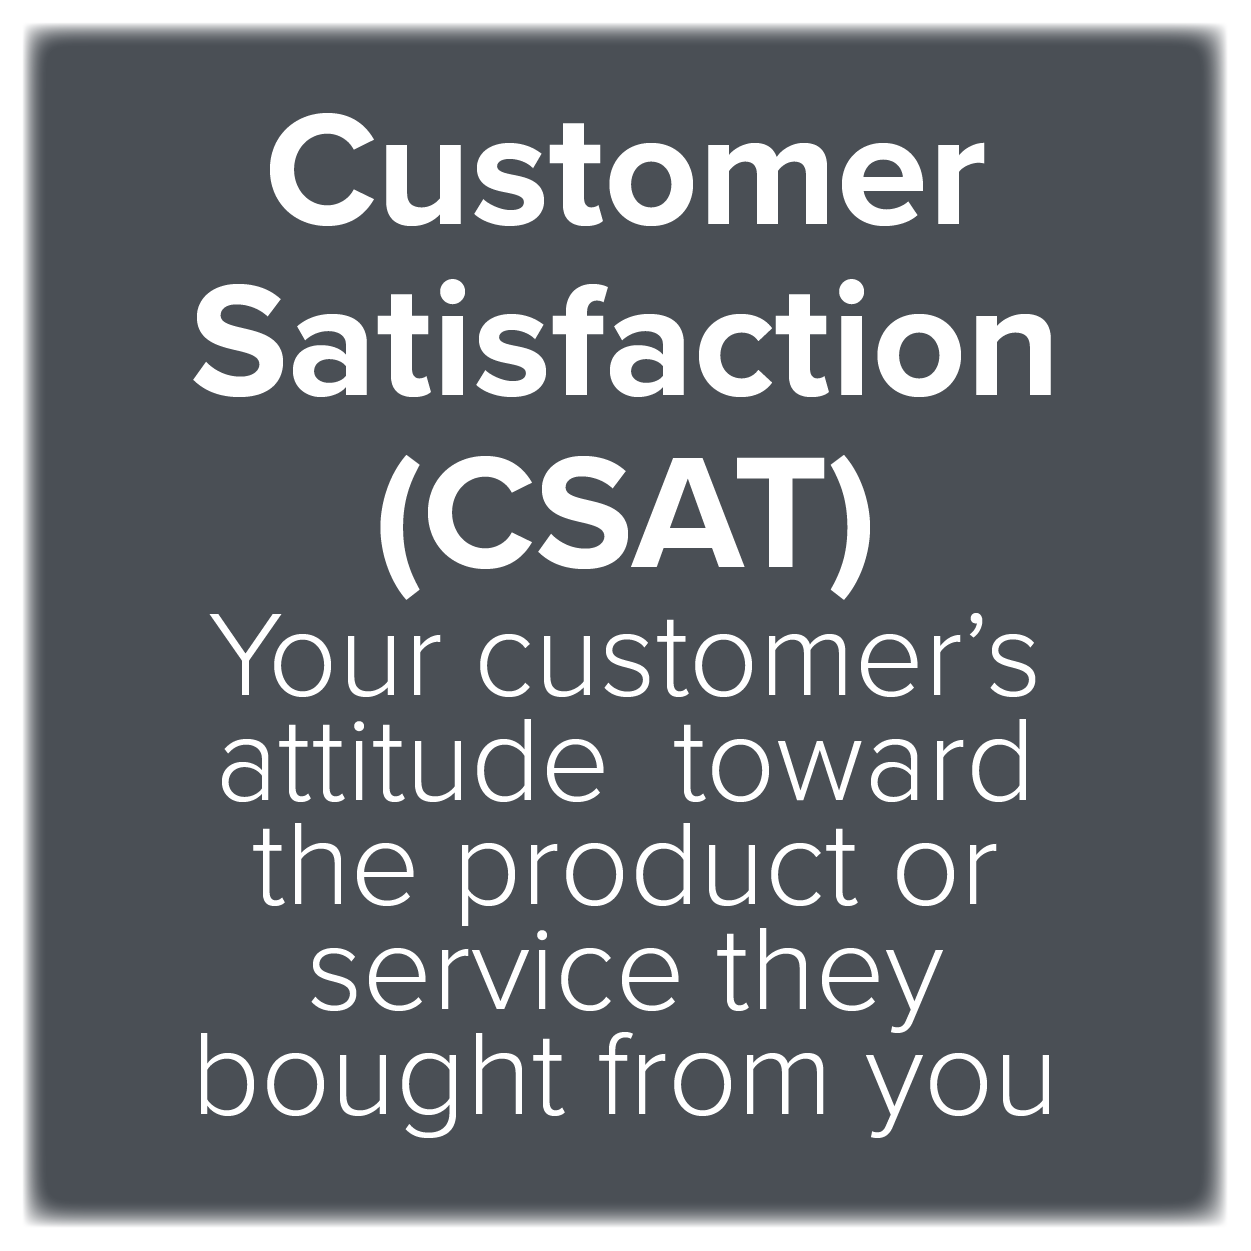
When you log into LoyaltyLoop, you are presented with one or more of these CX metrics that allow you to track your progress at a glance. What you see is based on the questions which were chosen when your survey was set up or last edited. Of the metrics you may see, CSAT (Customer Satisfaction) is calculated by taking the percentage of customers who indicated they’re “satisfied” in any way (i.e., Very or just satisfied) divided by all other choices (i.e., Those who are not sure or not satisfied). PQUAL (Product Quality) is calculated using the same method. And NPS (Net Promoter ScoreSM) is calculated as the percentage of Detractors subtracted from the percentage of Promoters. NPS and this calculation are described in greater detail here.
CSAT – This metric is one of the simplest to implement and fastest for your customer to answer. When presented with this standard and common question, the customer already knows whether they’re satisfied and can quickly choose an answer. Much like leaving a star rating on a Google review, it’s simple to score, and there’s little ambiguity in the score result.
What to do with CSAT – Measuring customer satisfaction gives you a bird’s eye view of your customers’ experience. Use CSAT to help you improve processes when serving your customers: How well do you support your customers? How is your employees’ service etiquette?
PQUAL – Product quality is more fluid than CSAT. With CSAT, your customer’s satisfaction is clearly defined by their answer. With PQUAL, before your customer provides feedback on the quality of a product, they first make a snap decision as to what quality means to him or her. For example, quality could mean the durability of a product to one customer and quality could mean the materials used in manufacturing to another. Your customer puts a little more thought into their purchase and rates it accordingly.
What to do with PQUAL – Ask your customers what specifically can be improved. Remember, each customer defines quality differently. See if you can discern what they value. Then, armed with this information, consider their suggestions with the goal of associating your brand with quality products.
NPS – To measure your customers’ loyalty to your brand, they are asked a simple question about how likely it is they would recommend your business to someone else, a friend, family member, a colleague, etc. To answer this question, your customer is asking themselves how loyal they are to your brand. Their answer then categorizes them as either a Promoter, a Passive, or a Detractor.
What to do with NPS – Use the NPS metric to gauge your customers’ loyalty, but be careful not to chase the score itself. Your goal is to build a company culture focused on delivering great customer experiences. Great customer experiences drives loyalty.
Focus on the changes you can make that will ultimately improve the score, indicating you’re delivering better customer experiences. The feedback data in LoyaltyLoop arms you with many ways to identify changes you can make to improve loyalty. It could be as simple as ensuring you consistently reply to your Google reviews, showing customers (and anyone else who views your reviews) you’re paying attention and appreciate your customer taking the time to post a review.
Read your survey comments to identify trends that can lead you to make improvements that affect many customers. Consider any other ways in which you can improve communication with your customers and implement them. Share your feedback results with your employees so everyone is on the same page about what can be improved. Follow your results over time on LoyaltyLoop to track the success of your changes.
When a customer is dissatisfied or unlikely to recommend you, read their full response and reach out to them to understand their perspective of what you can do to better. Sustained engagement with all of your customers, Promoters, Passives, and Detractors, will help you listen and learn what you can do to drive greater customer loyalty.
Do you measure CSAT and PQUAL in your LoyaltyLoop dashboard? If you login and you see only one or two charts, then you’re not collecting all of the CX metrics that LoyaltyLoop offers. Please contact support so one of our experts can help you with collecting this feedback by calling or emailing us at support@loyaltyloop.com.