
Customer Satisfaction Survey Best Practices: A 23-Point Checklist
You send the survey, wait, and get back a trickle of responses you can't do much with. Or the responses come in fine, but they sit in a report nobody acts on. Three months later, and you're in the same spot. You're not sure which customers are at risk, what's actually broken, or whether the program is working at all.
The problem usually spans the whole process, not just one part of the survey: what happens before, during, and after you send it. Producing usable data requires more than good questions. Customer satisfaction survey best practices cover three things together:
- How you design the survey before it goes out
- The cadence rules that keep customers from tuning you out
- The follow-up workflow that turns responses into action
Get all three right and you stop guessing about customer health. Instead, you start catching churn risk, dormant accounts, and service gaps before they cost you.
Main Takeaways
- A complete survey program covers three phases: design before you send, timing and frequency during deployment, and follow-up workflows after responses arrive.
- CSAT, NPS®, CES, and PQS each measure something different. The right metric depends on the survey moment, not personal preference.
- Keep surveys to two to five questions and ask the overall rating first. This tends to produce cleaner, more comparable data.
- Frequency caps matter as much as send timing. Repeat customers surveyed too often stop responding altogether.
- Trend direction over three to four quarters tells you more than any single score. Negative feedback requires acknowledgment within 24 hours to close the loop.
Raise Your Response Rate Without Annoying Customers
Low response rates usually come down to timing, friction, or over-surveying the same people. Seven specific fixes cover the most common causes.
Read the Response Rate GuideWhat a Customer Satisfaction Survey Is (and When to Use One)
A customer satisfaction (CSAT) survey is a structured set of questions you send after a transaction, service interaction, or relationship milestone. It measures the gap between what a customer expected and what they experienced. That gives you a measurable signal you can track over time.
Three trigger points cover most use cases:
- Post-transaction: Right after a purchase or delivery
- Post-support: After a service ticket closes
- Periodic relationship check-ins: Quarterly or at contract milestones
The survey itself is the collection tool. The metric you attach to it shapes the insight you get back. A CSAT question tells you whether a specific interaction went well. A Net Promoter Score℠ (NPS®) question tells you whether the customer would recommend you. Customer Effort Score (CES) tells you how much work the interaction required. Same instrument, different lens.
The Before–During–After Framework
A survey program that produces usable data has three phases:
- Before: Design and metric selection
- During: Timing, delivery, and fatigue management
- After: Response workflows, benchmarks, and continuous improvement
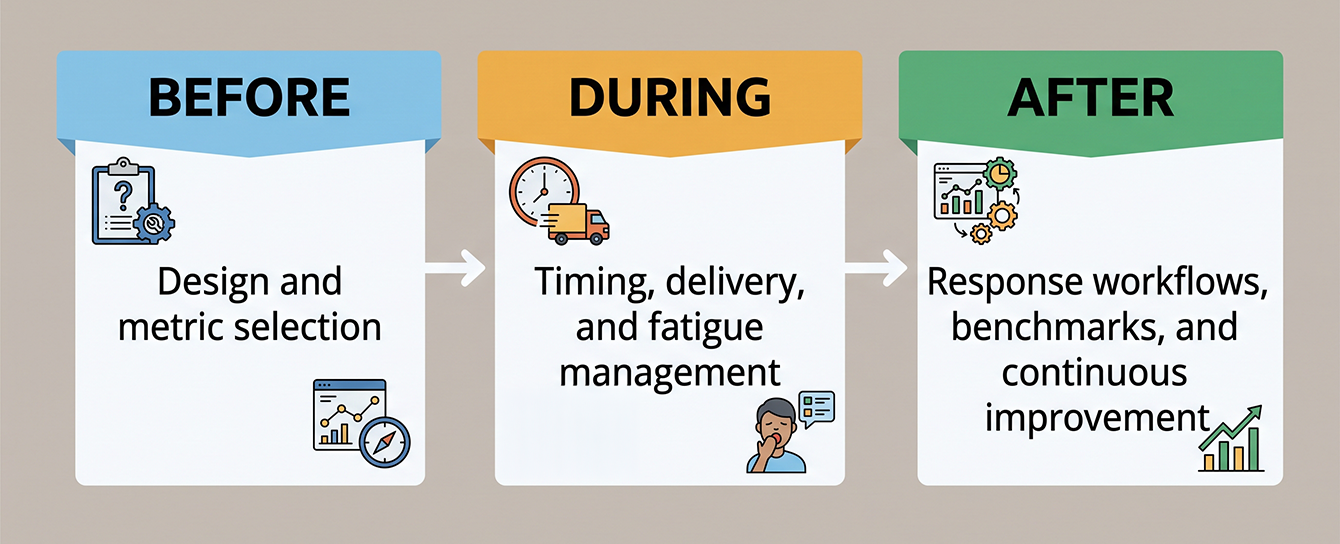
Each phase owns a distinct set of decisions. Before covers question design, scale selection, and objective setting. During covers send timing, channel choice, and frequency limits. After covers acknowledgment workflows, escalation paths, and trend tracking. The rest of this guide walks through each phase in order, ending with a combined checklist.
Most survey advice stops at design. You'll learn what to ask, but not what to do when responses arrive. That gap matters more now than it used to. Customer experience (CX) quality in the US has declined for two straight years. According to Forrester's 2025 Global Customer Experience Index, a quarter of US brands saw their CX rankings drop this year, compared to only 7% that improved. A program that collects data and doesn't act on it costs you twice: once in the time you spent building it, and again in the churn you didn't catch.
What to Get Right Before You Send: Survey Design Best Practices
Clean data starts with a clear objective, a short survey, one consistent scale, and an optional open-text field that lets customers explain their scores. It also means using logic to keep the survey lean and testing it before anyone else sees it. The choices you make before you send shape everything that comes next. Get the design right, and you'll have responses you can actually use.
Set Your Objective and Keep the Survey Short
Start with one question before you write any survey questions: what decision will this data inform? That answer tells you whether you need a CSAT score, an NPS® rating, or something else. Every survey should trace back to a specific action you'll take with the results.
Limit the survey to two to five questions. Every additional question adds a moment where a customer can decide to stop, and transactional surveys don't have the built-in motivation that keeps someone working through a long academic or government questionnaire. Every added question could cost you responses. If you can't tie a question to a specific action, cut it.
Ask the Overall Rating First, Then Get Specific
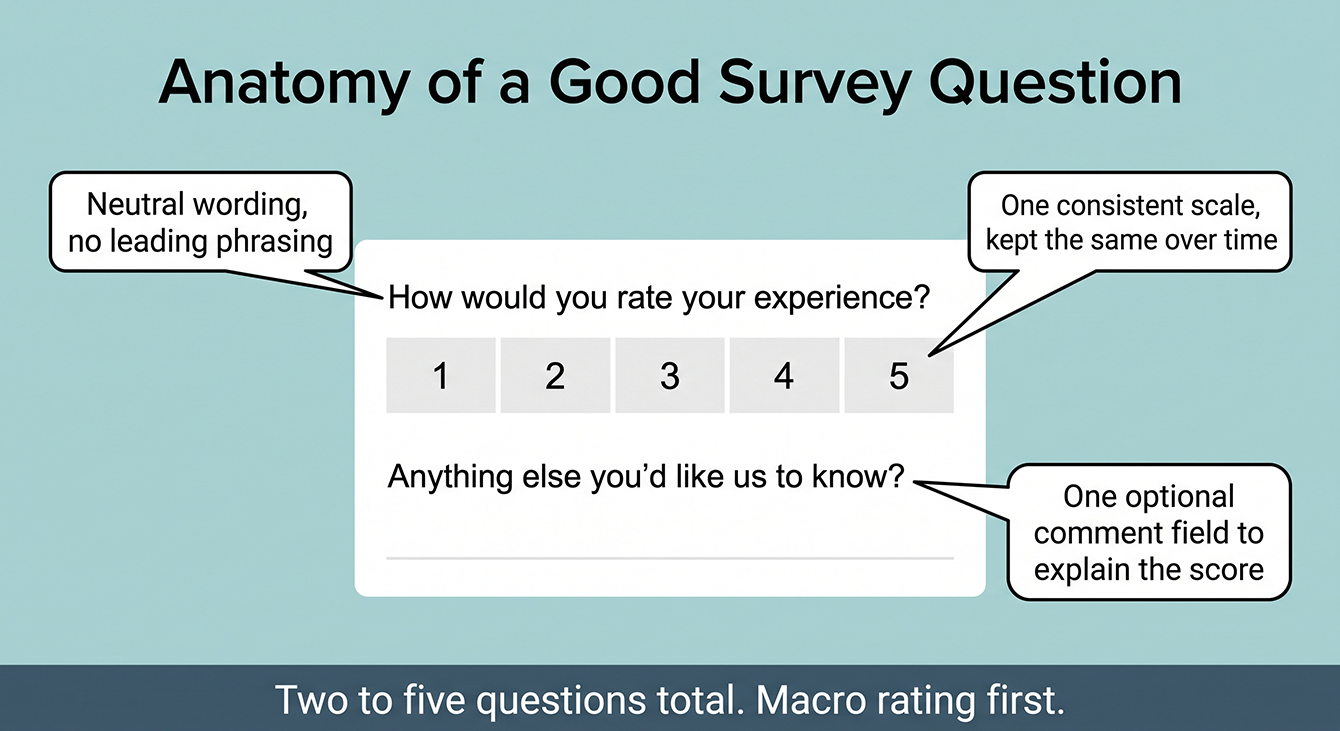
Lead with the overall satisfaction rating. Ask a broad "How satisfied were you?" before drilling into specific touchpoints. Individual complaints anchor the overall score when they come first. The broad question needs to land before the customer fixates on one frustrating detail.
Pick one scale per question and stick with it. A 5-point Likert scale converts opinions into numbers by labeling each point from "Very Dissatisfied" (1) to "Very Satisfied" (5). It gives you a consistent measure you can track across surveys and over time. When you switch a question from 5-point scale to a 10-point scale on another, your results can stop being comparable.
Add an Open-Text Field and Avoid Risky Wording
Include one optional open-ended text field, something like "Anything else you'd like us to know?" This is where customers explain the score. A 4 out of 5 tells you the experience was good. The comment tells you the delivery was two days late but the product was excellent. That operational detail is what a number alone can't give you.
Avoid double-barreled questions, which ask about two things at once ("How satisfied were you with our speed and quality?"). The customer can't answer cleanly because speed might have been great while quality wasn't. You can't act on the result either because you don't know which half the score reflects. Watch your phrasing for bias, too. "How great was your experience?" assumes the experience was great. "How would you rate your experience?" lets the customer tell you.
Use Skip Logic to Keep Extra Questions From Adding Length
If you need a follow-up question for detractors that doesn't apply to promoters, don't make every respondent answer it. Skip logic shows a question only to the people it's relevant to, so a dissatisfied customer gets asked what went wrong while a satisfied one moves straight to the next step. This lets you go deeper with the customers who need it without adding perceived length to the survey for everyone else. Most survey platforms support this natively. If yours doesn't, that's a sign the platform will limit you as your program matures.
Validate and Test Before You Send
Before you send anything, run the survey yourself end to end, on both desktop and mobile. Check that the logic branches correctly, the scale renders the same way on every device, and the open-text field actually saves what you type. A broken survey doesn't just cost you responses. It costs you data quality on the responses you do get, from people who worked around a rendering issue instead of answering cleanly.
Choose the Right Metric for the Right Moment
Four metrics cover the full picture of the customer experience:
- CSAT for transaction-level happiness
- NPS® for loyalty and referral likelihood
- CES for effort and friction
- PQS (Perceived Quality Score) for product or deliverable quality
Each one fits a different survey moment and answers a different question. The table below maps each metric to what it measures, when to send it, and what benchmark range to watch.
CSAT vs. NPS vs. CES vs. PQS Comparison Table
| Metric | What It Measures | Best Survey Moment | Benchmark Range |
|---|---|---|---|
| CSAT | Transaction-level satisfaction | Post-transaction (within 24 hrs) | 75–85% good; 85%+ excellent |
| NPS® | Loyalty and referral likelihood | Relationship / quarterly | +30 good; +50 excellent |
| CES | Effort to resolve an issue | Post-support (same day) | Lower is better; track trend |
| PQS | Product/deliverable quality | Post-delivery | Industry-specific; track trend |
Example Questions for Each Survey Moment
Matching a question to the right metric and moment gets easier with a starting template:
- Post-transaction CSAT: "How satisfied were you with your recent purchase/delivery?" (5-point scale) + "Anything else you'd like us to know?"
- Post-support CES: "How easy was it to get your issue resolved?" (5-point scale, Very Difficult to Very Easy) + "What made this harder or easier than it needed to be?"
- Relationship NPS®: "How likely are you to recommend [company] to a colleague or peer?" (0–10 scale) + "What's the main reason for your score?"
- Post-delivery PQS: "How would you rate the quality of what you received?" (5-point scale) + "What would have made this better?"
Use these as a starting point, not a script. Swap in your own product or service language, but keep the structure: one rating question, one open-text follow-up.
The Four Ways to Measure Customer Satisfaction
Surveys are one of four methods you can use to measure customer satisfaction. Together, they give you the full picture:
- Survey scores (CSAT, NPS®, CES, PQS) give you structured data tied to specific moments in the customer relationship.
- Qualitative feedback from open-text survey responses explains the "why" behind the numbers.
- Behavioral signals like churn rate, repeat purchase frequency, and account dormancy show you what customers do. That sometimes contradicts what they say.
- Social and review monitoring across Google, industry sites, and social platforms captures sentiment you didn't ask for.
Surveys give you the structured signal. The other three methods give you context and confirmation. A strong program uses all four, but surveys are the foundation. They're the only method where you control the question, the timing, and the audience.
When to Send Surveys and How to Prevent Survey Fatigue
Timing determines whether your survey gets a response or gets ignored. Send too late and the experience fades from memory. Send too often and customers stop responding. Channel, format, and even your subject line all factor in too. Here's how to find the sweet spot with customer satisfaction survey best practices.
Timing Windows by Survey Type
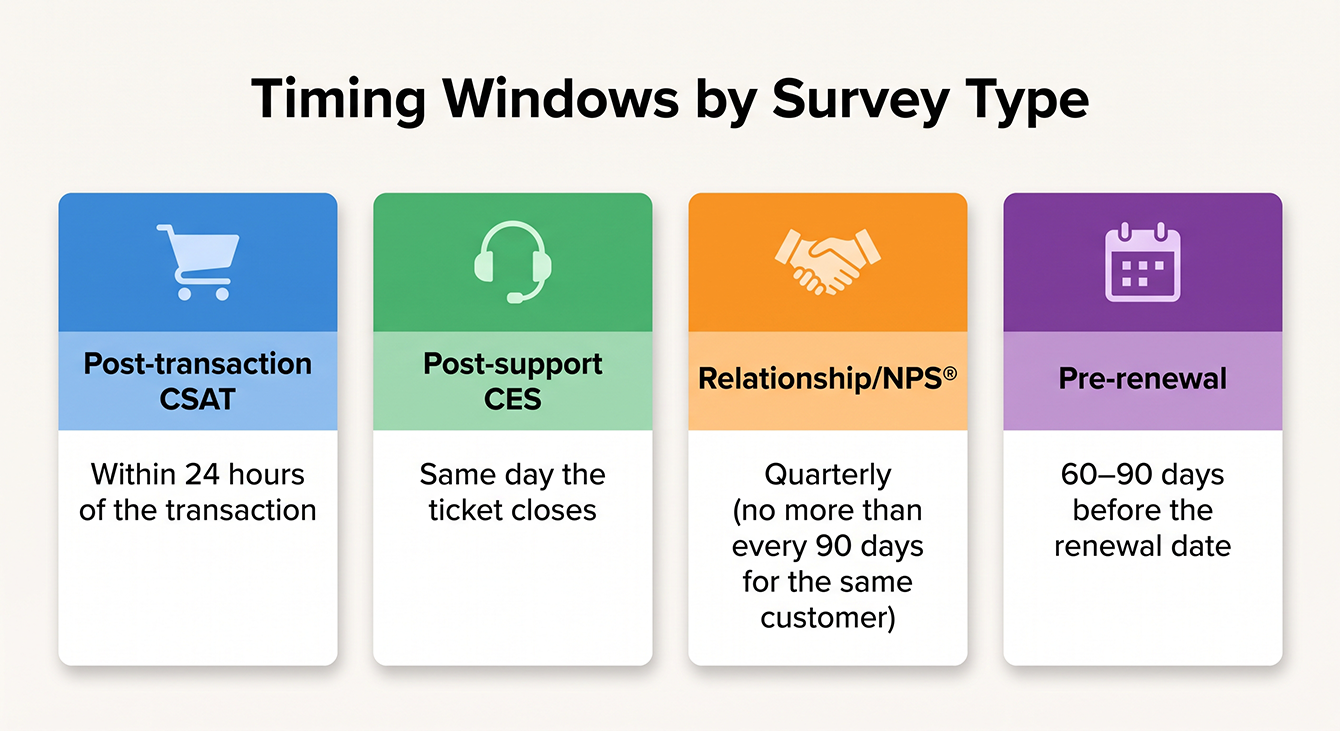
- Post-transaction CSAT: Within 24 hours of the transaction
- Post-support CES: Same day the ticket closes
- Relationship/NPS®: Quarterly (no more than once every 90 days for the same customer)
- Pre-renewal: 60–90 days before the renewal date
Channel, Format, and Subject Lines
Channel matters, too. SMS text invitations produce fast results. A 2025 Gallup report found 47% of recipients responded the same day they received an SMS survey invite. For time-sensitive surveys like post-transaction and post-support, pairing email with SMS captures responses while the experience is still fresh. For relationship surveys where urgency is lower, email alone works fine.
Whatever channel you use, design for the phone first. Most survey responses now come from mobile, and a scale that's easy to tap on desktop can be nearly unusable as a cramped row of radio buttons on a small screen.
If you're sending by email, the subject line decides whether any of this timing work matters. Keep it under 50 characters, make it obvious you're asking for feedback, and personalize it where you can ("[Name], how did we do?" outperforms a generic "We'd love your feedback"). A well-timed survey with a weak subject line still goes unopened.
Frequency Limits and Reminder Rules
Set a per-customer frequency cap. High-frequency accounts are often your best customers. Over-surveying them is the fastest way to train them to ignore you. For repeat customers, no more than one survey every 90 days regardless of how many transactions they complete.
Limit reminders to one follow-up within 48–72 hours. A 2024 US Census Bureau experiment found that a second text matched the first in response yield. A third got fewer replies. More reminders don't mean more responses. If you use SMS, automate "STOP" processing and honor opt-outs promptly. A 2024 Federal Communications Commission (FCC) ruling requires you to honor consent revocation within 10 business days.
Adhering to that ruling doesn't have to be complicated. LoyaltyLoop's Touch Frequency Filter enforces per-customer frequency caps automatically. Repeat customers don't get surveyed after every transaction. You set the business rules once, and the system applies them without anyone on your team managing a suppression list.
See How CSAT, NPS, CES, and PQS Work Together
Picking the right metric for each survey moment is easier when you can see all four in one place. Learn how LoyaltyLoop brings the metrics that matter under a shared dashboard.
Explore Customer Experience SurveysHow to Close the Feedback Loop After Responses Arrive
Collecting the response is only the first half of the job. What you do next determines whether that feedback leads to anything useful. Closing the feedback loop means every response triggers a defined next step:
- Acknowledgment for negative feedback
- Resolution for the issue behind it
- A specific ask for positive feedback
No response sits unread.
Negative and Passive Responses: Acknowledge, Resolve, Confirm
The sequence for negative feedback should run like this:
- Alert the right person immediately. A Poor Feedback Alert should fire the moment a detractor or low-CSAT response arrives. Don't wait for a weekly summary report.
- Acknowledge within 24 hours. According to HubSpot's 2024 State of Service, 82% of service leaders say customers now expect immediate resolution.
- Resolve the issue and confirm the outcome with the customer. Document the root cause so you can spot patterns across responses.
Passives are the quiet risk. They aren't angry enough to complain, but they aren't loyal enough to stay. A brief check-in to understand what would move them from "fine" to "great" costs you five minutes and can boost overall retention rates.
Positive Responses: Reviews, Testimonials, and Referrals
Promoters are your most underused asset. Ask them for a public review while the positive experience is still top of mind. This is a proactive ask, not a filter — every customer can leave a public review regardless of their survey response. According to a 2025 BrightLocal survey, 80% of consumers say they'd use a business that responds to every review. That drops to 42% for businesses that don't respond at all. The review itself matters, and so does your reply.
With permission, reuse positive survey comments as testimonials on your website and sales materials. Route referral-ready customers to a referral ask before the energy fades. A promoter who just told you they'd recommend you is the warmest referral lead you'll ever get.
Benchmarks That Tell You the Program Is Working
Benchmarks give you a baseline to judge your program against. They help you tell whether the system is producing reliable, improving data over time. Different metrics will have different benchmarks. For example, what's considered "good" for NPS might be "bad" for CSAT.
- CSAT: 75–85% is good; above 85% is excellent. Below 70% signals a deeper issue worth investigating right away.
- NPS®: +0 is okay, +50 is good; +70 is excellent. A negative NPS means detractors outnumber promoters.
- Response rate: 20–30% is typical for email surveys; above 40% is strong. Below 10% means your timing, channel, or survey length needs work.
Remember: a single score is a snapshot. The trend over three to four quarters tells you whether your program is improving or just holding steady. Track direction, not just position. A CSAT of 78% that was 72% two quarters ago is a better story than a CSAT of 82% that was 86% last quarter. When you report internally, include both the score and the trend so the data tells the full story.
Common Survey Mistakes That Corrupt Your Data
Survey mistakes don't just lower response rates. They make the data you do collect unreliable, which is worse than not surveying at all. A high response rate on a badly designed survey gives you confident-looking data that points you in the wrong direction. The table below shows the most common errors and what to do instead.
| Mistake (Don't Do This) | Why It Corrupts Data | Do This Instead |
|---|---|---|
| Leading questions ("How great was…?") | Biases toward positive responses | Use neutral phrasing ("How would you rate…?") |
| Double-barreled questions ("speed and quality") | Customer can't answer one thing cleanly | Ask one question per concept |
| Inconsistent scales on same question (5-point, then 10-point) | Results aren't comparable across surveys | Pick one scale and keep it |
| Too many questions (10+) | Abandonment rises; late answers are low-effort | Limit to 2–5 questions |
| Changing recurring survey wording | Breaks trend comparison | Lock wording; version-control changes |
| No open-text option | You get scores but no explanation | Add one optional comment field |
The worst outcome is making a business decision based on data that was skewed by the way you asked the question — that's more costly than a low response rate, because it looks confident when it shouldn't be. Bad survey design doesn't just waste the customer's time. It wastes yours, because you'll act on numbers that don't reflect reality. Run every survey through this table before you send it. Don't change a recurring survey's structure without documenting the break in comparison.
What a Managed Survey Program Handles for You
A managed program means someone else configures the survey and sets the business rules. They enforce frequency caps, route alerts, and keep the program running month after month. You review the data and act on the insights. You don't maintain the system. That matters when you consider how much goes into surveys to begin with.
Running a survey program means maintaining ongoing tasks like:
- Survey design and updates
- Contact list management
- Frequency enforcement
- Alert routing
- Review request workflows
- Testimonial collection
- Benchmark tracking
- Compliance work like opt-out processing and consent management
Most businesses start strong but let the program decay within a few months because no one owns it day to day. Platform risk adds to the problem. Delighted, a widely used CX tool, sunset in June 2026. That forced migrations and left programs in limbo during the transition, a reminder that platform stability matters as much as features when you're picking a survey tool. A managed survey program takes design, timing, alerting, and follow-up workflows off your plate. The program runs reliably without requiring someone on your team to maintain it.
We run LoyaltyLoop this way. Surveys go out at the right time based on business rules. Poor Feedback Alerts fire immediately, and reviews and testimonials are solicited in the same workflow. The Touch Frequency Filter prevents over-surveying. Our average customer stays for 8–10 years because the program runs without creating internal work.
Best Practices for Customer Satisfaction Surveys: The Full Checklist
The checklist below combines every best practice from the guide. Use it to audit an existing feedback management program or build a new one. Print the graphic above to use in your business.
Before (Design)
- Set a clear objective: What decision will this data inform?
- Limit the survey to 2–5 questions.
- Ask the macro rating first.
- Use one consistent scale per question (like a 5-point Likert).
- Avoid leading and double-barreled questions.
- Add one optional open-text field.
- Match the metric to the survey moment (CSAT, NPS, CES, or PQS).
- Validate the survey and test it across devices before sending.
During (Deployment)
- Send post-transaction surveys within 24 hours or soon after the experience.
- Send post-support surveys the same or next day.
- Send relationship/NPS surveys quarterly.
- Cap repeat customers at one survey per 90 days.
- Limit reminders to one follow-up.
- Use SMS + email for time-sensitive surveys.
- Automate opt-out processing.
After (Follow-Up)
- Route negative feedback alerts immediately.
- Acknowledge negative responses within 24 hours.
- Resolve the issue and confirm with the customer.
- Follow up with passives to understand the gap.
- Ask promoters for a public review.
- Reuse positive feedback as testimonials (with permission).
- Track CSAT, NPS, response rate quarterly.
- Compare trends over 3–4 quarters, not single scores.
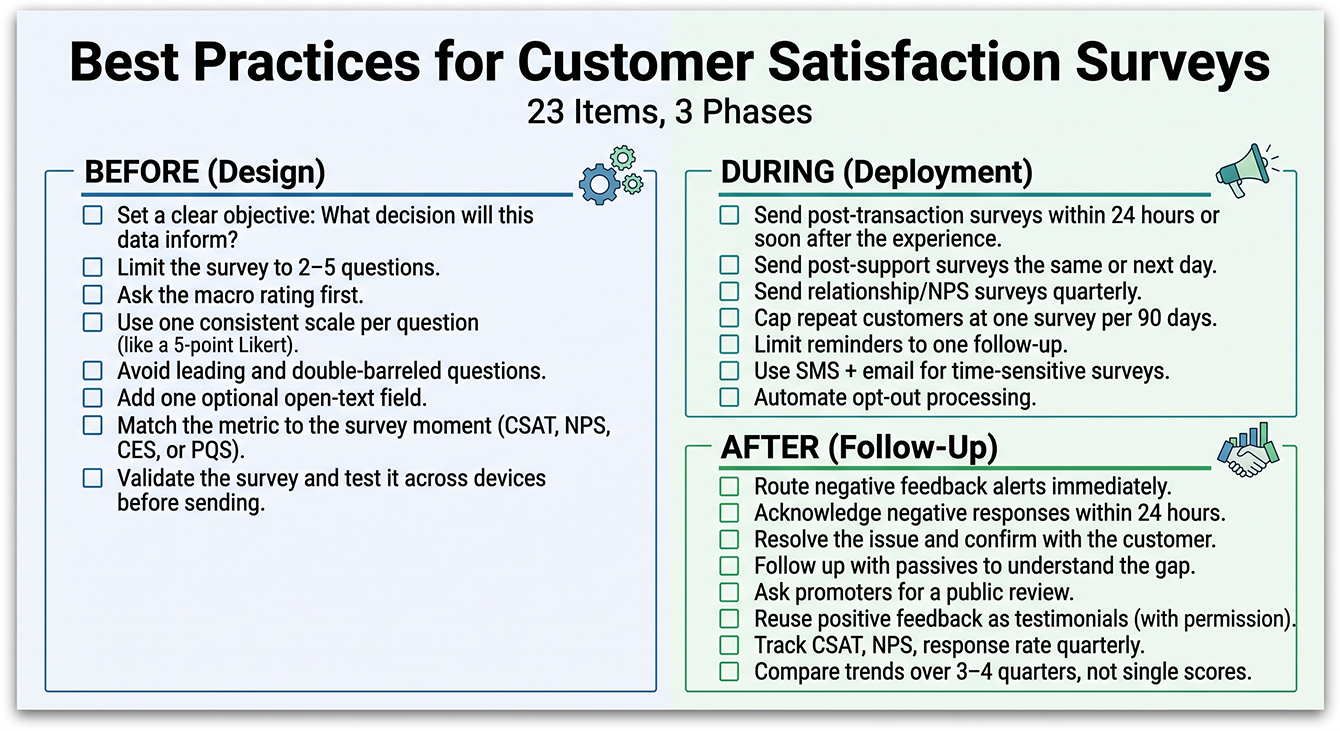
23 items, 3 phases. Print it, share it with your team, and use it as a quarterly audit to make sure nothing has drifted.
Start Building a Survey Program That Actually Runs with LoyaltyLoop
You're now geared with a three-phase checklist for building a survey program that collects responses, produces reliable data, and drives action after feedback arrives. The design rules keep your data clean. Cadence rules keep your customers from tuning you out. Follow-up workflows turn scores into retention, reviews, and revenue, quarter after quarter.
We built LoyaltyLoop to run the entire program for you. Survey design, frequency limits, alert routing, and follow-up workflows stay active. No one on your team has to maintain them. Every location follows the same survey cadence. Negative feedback reaches the right person within minutes, and promoters turn into reviews and testimonials without manual work.
Discover how LoyaltyLoop builds and manages a complete survey program.
See the 23-Point Checklist Running as a Live Program
A checklist tells you what good looks like. A demo shows you what it looks like running without anyone on your team maintaining it.
Schedule a DemoFrequently Asked Questions (FAQs)
Q: How do I choose between CSAT, NPS, and CES for my business?
A: Match the metric to what you're measuring. Use CSAT when you want to know if a specific transaction met expectations. Use NPS® when you're measuring long-term loyalty and referral likelihood. CES works best when you need to understand how much effort a support interaction required. Most businesses start with CSAT because it's the simplest to set up and the easiest for customers to answer.
Q: What's a realistic response rate, and how do I improve it without annoying customers?
A: A response rate between 20% and 30% is typical for email surveys. Above 40% is strong. If you're below 10%, the problem is usually one of three things: sending too late after the experience, asking too many questions, or over-surveying repeat customers. Send post-transaction surveys within 24 hours, or after the customer has received/experienced your product/service. Send post-support surveys the same or next day. Cap repeat customers at one survey every 90 days regardless of transaction volume.
Q: What do I do if a customer leaves negative feedback but doesn't want to be contacted?
A: Acknowledge the feedback internally. Document the issue and root cause, then fix the underlying problem without forcing contact the customer declined. Negative feedback that opts out of follow-up is still valuable operational data. Use it to improve the process for the next customer, even if you can't resolve it with the one who reported it.
Q: How do I get my team to actually follow up on survey responses instead of just reading the reports?
A: Make follow-up automatic. Route negative feedback alerts directly to the person who can fix the issue the moment the response arrives. If not automated as part of your survey workflow as with LoyaltyLoop, positive feedback should trigger a specific ask: a review request, testimonial permission, or referral prompt. That way the team knows exactly what action to take. Set a 24-hour acknowledgment rule so follow-up becomes a workflow step, not a monthly review task. If follow-up depends on someone checking a dashboard, it won't happen reliably.
Q: Can I use LoyaltyLoop to run surveys if I don't have a lot of transactions per month?
A: Yes. We built LoyaltyLoop around business rules you set, not transaction volume. It works for businesses with infrequent customer touchpoints. MSPs, consultants, and project-based businesses often run quarterly NPS relationship surveys rather than transactional surveys after every interaction. Our managed service model means we configure the timing rules for your business type.