Customer Satisfaction Metrics: 7 KPIs to Track in 2026
For small to mid-sized businesses (SMBs), customer feedback has historically been driven by gut feelings and anecdotes. You knew an account was healthy because the client smiled during a lunch meeting, or you assumed a residential customer was happy because they paid their invoice on time.
But in 2026, relying on assumptions is a significant business risk.
Customer expectations are higher than ever, and operational costs leave little room for error. To survive and scale, SMBs must transition from vague impressions to quantifiable data. Managing your business reputation requires a clear framework of customer satisfaction metrics.
A truly comprehensive feedback strategy balances two distinct types of data: attitudinal metrics (what your customers say) and behavioral metrics (what your customers actually do). This guide serves as an overview pillar of the 7 vital customer experience KPIs your business should track this year, breaking down what they measure, how to calculate them, and how to tie them together without drowning in admin work.
Main Takeaways
- The strongest measurement programs pair attitudinal metrics (how customers feel) with behavioral ones (what customers do).
- CSAT, NPS®, and CES capture sentiment. Retention rate, churn rate, and first-contact resolution show what's actually happening.
- No single metric tells the whole story. Looking at one in isolation can hide a problem another would catch.
- Tracking these by hand gets messy fast. The real value comes from numbers that update on their own and break down by location.
Part 1: The Core Survey-Based Metrics (The Attitudinal KPIs)
Survey-based metrics capture direct human sentiment at various touchpoints in the customer lifecycle. When exploring how to measure customer satisfaction, these three core frameworks form the bedrock of modern customer experience management.
1. Customer Satisfaction Score (CSAT)
CSAT is the real-time pulse of your day-to-day operations. It answers a foundational question: How happy is the customer with a specific, recent interaction? Because it captures immediate sentiment, it is highly transactional.
- How it’s calculated: Customers rate an experience on a scale (typically 1 to 5, from Very Dissatisfied to Very Satisfied). Your CSAT score is the percentage of respondents who rate you a 4 or 5 (the "top-two boxes").
- When it matters: Send a CSAT survey immediately following a product delivery, a completed service call, or the closure of a customer support ticket.
2. Net Promoter Score℠ (NPS®)
While CSAT measures short-term happiness, NPS measures long-term relational loyalty and brand advocacy. It shifts the focus from a single transaction to the entire health of the relationship by asking how likely a customer is to recommend your business to a friend or colleague on a scale of 0 to 10.
- How it’s calculated: Respondents are grouped into Promoters (9-10), Passives (7-8), and Detractors (0-6). Your score is
calculated by subtracting the percentage of Detractors from the percentage of Promoters, resulting in a score between -100 and +100.
- NPS = %Promoters - %Detractors
- When it matters: Check your NPS periodically (quarterly or bi-annually), giving you an accurate baseline of your overall word-of-mouth growth potential.
3. Customer Effort Score (CES)
In the modern commercial landscape, convenience is a major competitive advantage. CES measures process friction. Instead of asking if a customer likes you, it asks: How hard was it to do business with us?
- How it’s calculated: Customers rate their agreement with a statement like, "The company made it easy for me to resolve my issue," on a scale of 1 to 7. Your score is the average of these responses.
- When it matters: CES is incredibly valuable when evaluating complex operational touchpoints, such as an e-commerce checkout flow, a new client onboarding sequence, or a technical support resolution.
Part 2: The Behavioral & Operational Metrics (The Actionable KPIs)
What customers say on a survey is only half the battle. To unlock the full value of your data, you must pair attitudinal feedback with behavioral metrics—the operational indicators that reveal the financial realities of your customer relationships.
4. Customer Retention Rate (CRR)
Your retention rate is the ultimate foundation of predictable, recurring revenue for small to mid-sized businesses. It tracks the percentage of existing customers who remain loyal partners over a specific timeframe.
- How it’s calculated: Take the number of customers at the end of a period (E), subtract new customers acquired during that
period (N), and divide by the number of customers you had at the start of the period (S). Multiply by 100 to get your percentage:
- CRR = { (E - N)/S } x 100
- When it matters: Audit your CRR quarterly or annually to ensure your core customer base is stable and that your growth isn't being masked by temporary sales spikes.
5. Customer Churn Rate
Churn is the inverse of retention; it represents the leaking bucket. Churn rate tracks the percentage of customers who cut ties, cancel subscriptions, or stop buying from your business over a given window.
- How it’s calculated: Divide the number of customers lost during a specific timeframe by the total number of customers you had
at the start of that timeframe, then multiply by 100:
- Churn Rate = (Customers Lost / Starting Customers) x 100
- When it matters: Watch this metric closely alongside your smb customer retention metrics. A sudden spike in churn is an early warning sign of systemic service failures, aggressive competitor pricing, or declining product quality.
6. First-Contact Resolution (FCR)
FCR measures the efficiency of your customer service, support, or dispatch teams. It tracks the percentage of customer issues or service requests that are completely resolved during the very first interaction, without requiring a call-back or follow-up visit.
- How it’s calculated: Divide the number of issues resolved on the first contact by the total number of issues received:
- FCR = (Resolved on First Contact / Total Issues) x 100
- When it matters: Track FCR monthly. High FCR rates correlate strongly with excellent CSAT and CES scores, as customers value getting their problems solved quickly and correctly the first time.
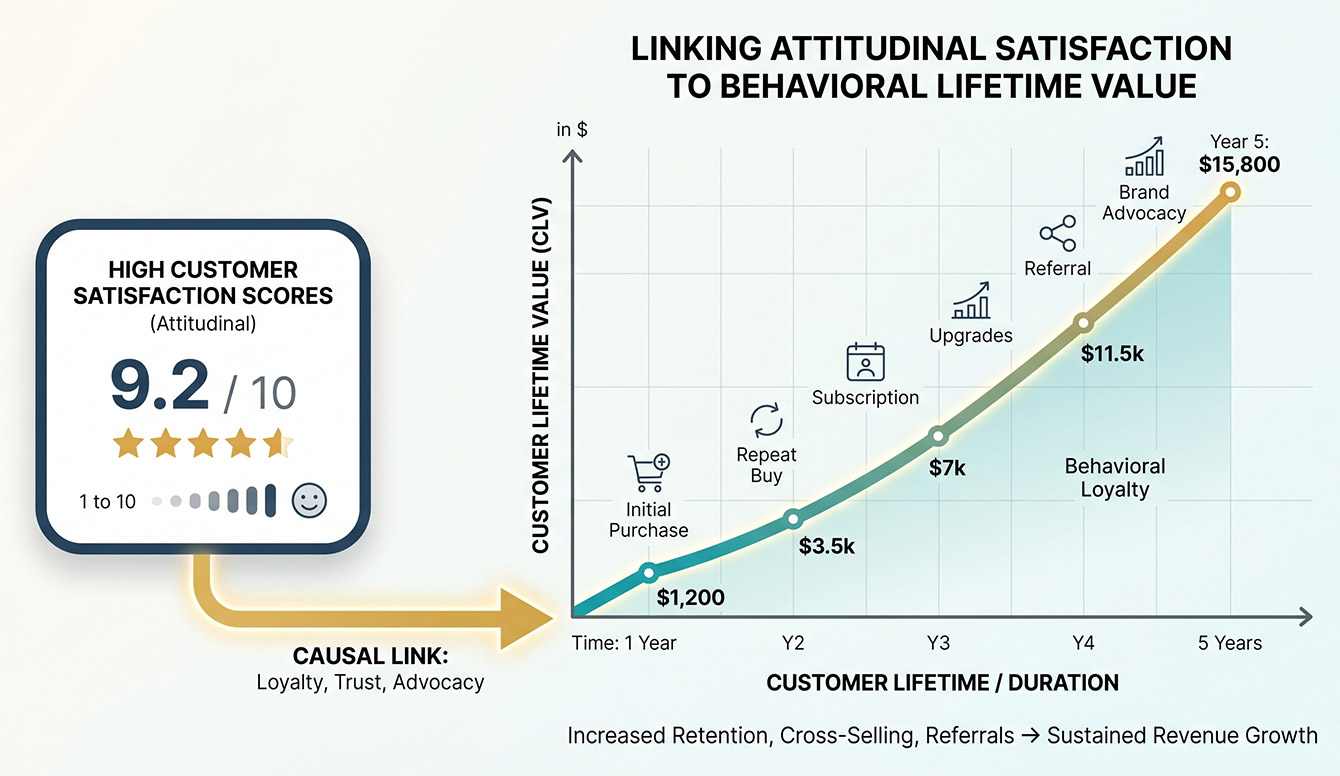
7. Customer Lifetime Value (CLV or LTV)
CLV calculates the total economic worth of a customer relationship over its entire duration. Understanding your CLV allows your business to make smart, data-driven decisions about how much money you can sustainably spend to acquire a new customer.
- How it’s calculated: Multiply the average purchase value by the average purchase frequency, then multiply that number by the
average customer lifespan.
- CLV = Avg Purchase Value x Avg Purchase Frequency x Avg Customer Lifespan
- When it matters: Use CLV as a high-level strategic KPI to evaluate long-term business health, segment your most profitable accounts, and optimize your marketing budgets.
Bringing It Together: The Danger of Metric Silos
The real magic of tracking customer satisfaction metrics happens when you look at the intersection of these numbers rather than viewing them in isolation. Looking at a single KPI can easily mask hidden operational vulnerabilities.
For example, a business might boast an incredibly high NPS score because their account managers are wonderful people. However, if your First-Contact Resolution (FCR) is dropping and your Customer Effort Score (CES) reveals high friction, those happy feelings won't save you from a spike in customer churn down the road.
Conversely, a business might have a flawless functional product and a great retention rate, but an incredibly low NPS score. This indicates a passive, vulnerable customer base that is staying with you out of habit or lack of clear alternatives, and they may jump ship the moment a cheaper competitor emerges.
To build a resilient business, you need a system that automatically connects these data points, painting a comprehensive picture of your health without turning your week into an administrative nightmare of spreadsheets and manual data entry.
CSAT benchmarks from American Customer Satisfaction Index (ACSI)
Based on the latest data from the American Customer Satisfaction Index (ACSI) released in the first half of 2026, the national cross-industry average for customer satisfaction is 76.7 (out of 100). This represents a slight dip from late 2025 but remains a reliable baseline for general consumer sentiment.
Because ACSI uses a standardized methodology across all sectors, these scores are directly comparable, meaning you can stack an internet provider against a bank to see how their customer experiences measure up. Here is a breakdown of recent ACSI industry benchmarks based on 2026 reports:
| Industry | Average ACSI Score (out of 100) |
|---|---|
| Full-Service Restaurants | 82 |
| Insurance / Banking | 80 |
| Quick-Service Restaurants (Fast Food) | 79 |
| Hotels | 77 |
| Food Delivery | 75 |
| Internet Service Providers (ISPs) | 73 |
| Social Media | 67 |
When measuring your own business against these benchmarks, remember to map your score directly to your specific sector. An ACSI score of 72 might represent a crisis for a local bank, but it would actually be an industry-leading triumph for a social media company. Find more benchmark data at the ACSI website.
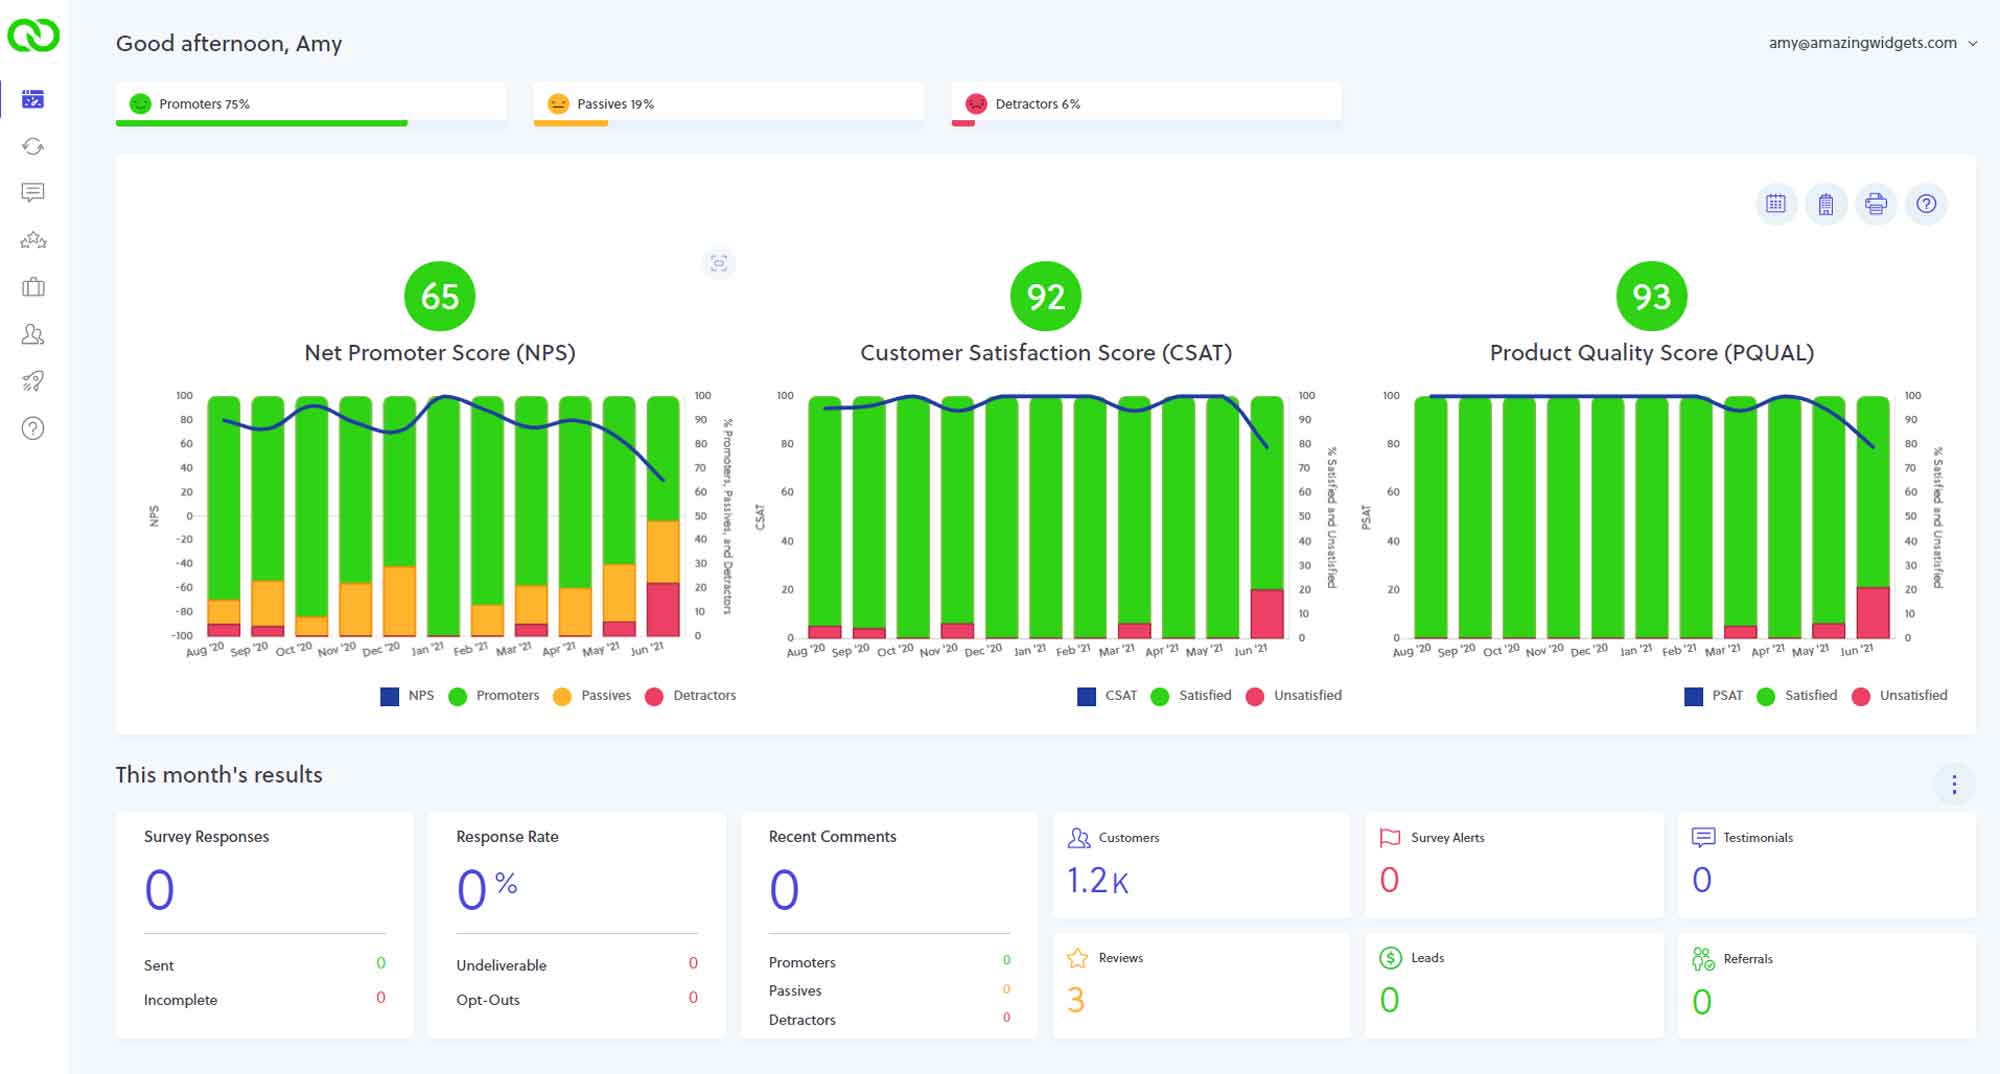
Spotlight: The LoyaltyLoop Automated Dashboard
For small to mid-sized businesses, the biggest obstacle to tracking these 7 KPIs isn't a lack of interest, it's a lack of time. Manually sending out various surveys, collecting responses, formatting calculations, and separating data across multiple company branches takes hours of valuable time that your team simply doesn't have.
This is why we built the LoyaltyLoop Automated Dashboard.
Instead of treating metrics as a tedious weekend administrative chore, LoyaltyLoop turns your feedback loop into an automated engine where your core numbers live, track, and update completely on their own.
- Real-Time Automated Tracking: LoyaltyLoop integrates directly with your existing POS or CRM workflows, triggering perfectly timed surveys via email or SMS and updating your dashboard instantly as responses roll in.
- Deep-Dive Metric Breakdowns: Skip the manual math. Our dashboard handles the calculations automatically, providing clean visual charts for your CSAT, NPS, and customer sentiment metrics across all subscription plans.
- Per-Location Views: If your business operates across multiple branches, territories, or physical locations, LoyaltyLoop allows you to filter and segment data seamlessly. Compare performance across regions, identify which branches are leading the pack, and uncover exactly where processes need refinement.
- Actionable Customer Alerts: The moment a low score or a high-friction alert is flagged on your dashboard, your management team is notified instantly, giving you the power to step in and save the account before it turns into churn.
Stop guessing how your customers feel or spending hours fighting with spreadsheets. Let automation reveal the true health of your operations so you can focus on building relationships that loop back again and again.
Ready to see your metrics update in real-time? Take total control of your online reputation and customer insights.
Schedule a DemoFrequently Asked Questions (FAQs)
Q: What is the main difference between CSAT and NPS?
A: The core difference lies in their operational scope. CSAT (Customer Satisfaction Score) measures short-term satisfaction tied to a specific transaction, product delivery, or support ticket. This is considered a lagging indicator of past behavior. NPS (Net Promoter Score) measures long-term, overall relational loyalty and a customer’s willingness to recommend your brand to others over time, and is considered a leading indicator of future behavior.
Q: Can a business track too many customer experience KPIs?
A: Yes. Tracking too many metrics simultaneously can cause "analysis paralysis," where your team gets overwhelmed by data points and struggles to prioritize improvements. For most small to mid-sized businesses, it is highly recommended to select 2 or 3 core survey metrics (like CSAT and NPS) and pair them with 2 operational indicators (like churn and retention) to keep your focus clear and actionable.
Q: How often should our internal customer metrics dashboard be updated?
A: Your dashboard should update in real-time or near-real-time. Customer sentiment changes rapidly, and waiting for an end-of-the-month review to calculate your scores means you are always acting on old data. Real-time updates allow you to spot customer issues immediately and resolve them before they hurt your retention rates.