Visualizing the "Why" Behind Your CX Scores
Now Trending: More Data, Less Guesswork
At LoyaltyLoop, we believe that a single number should tell a story. While tracking your high-level scores is essential for health checks, understanding the "how" behind the "what" is where the real magic happens.
We are excited to announce a great enhancement available on all LoyaltyLoop plans: detailed breakdowns of the underlying components for all CX metrics.
See the Full Picture
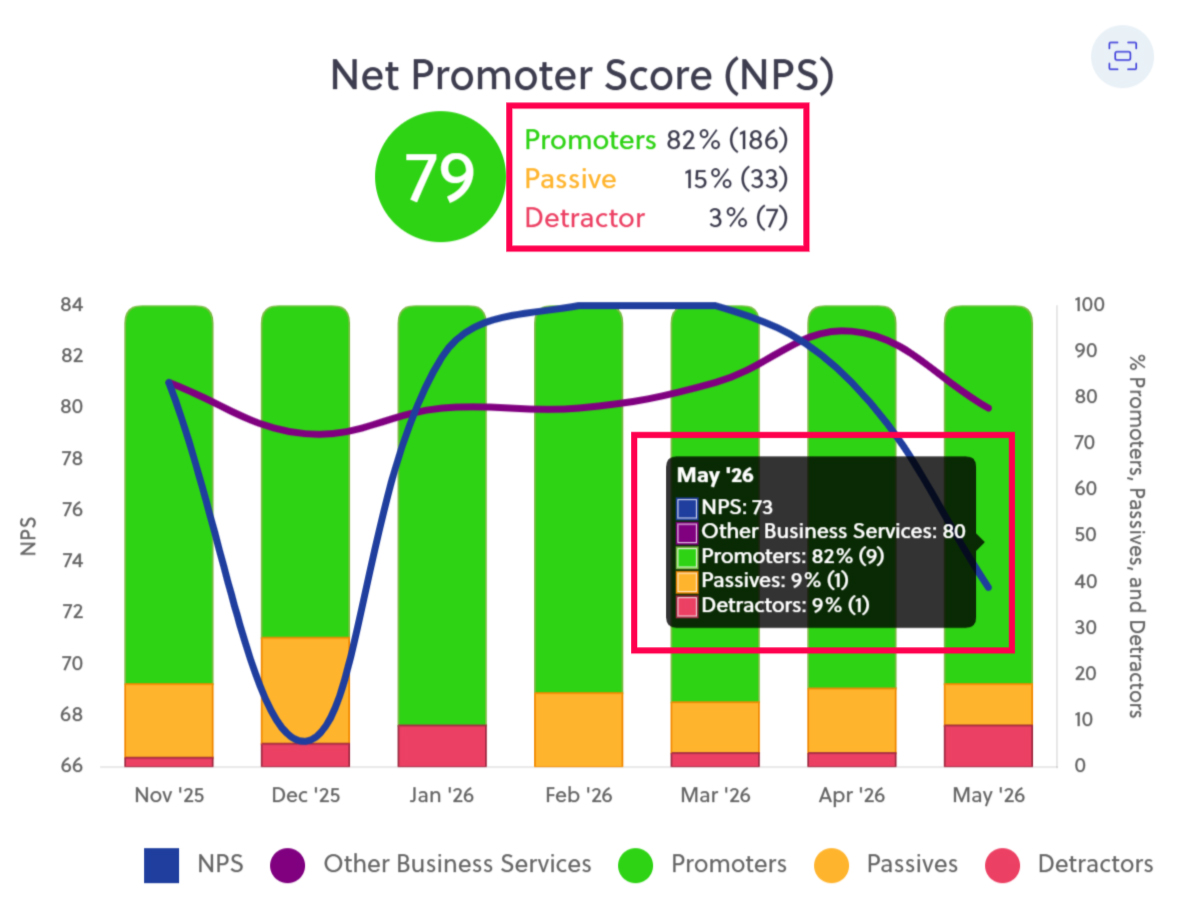
You no longer have to dig through raw data to find out how many respondents shaped your monthly score. Now, when viewing your customer experience (CX) charts, you will see a clear breakdown of the underlying components—including the exact number of respondents and the percentage breakdown.
These details are integrated directly into your workflow:
- Main Dashboard: View the breakdown immediately next to the main CX metric on your chart.
- Historical Trends: Simply hover over any specific month in your chart to see the respondent data for that period.
Universal Visibility
Whether you are tracking brand loyalty or ease of use, these components are now visible across our entire suite of metrics, including:
- Net Promoter Score (NPS)
- Product Quality Score (PQS/PQUAL)
- Customer Satisfaction Score (CSAT)
- Customer Effort Score (CES)
By bringing these numbers to the surface, we’re helping you make more informed, data-driven decisions for your business.
Ready to see your scores in a new light?
Log in to your LoyaltyLoop dashboard today to explore these new visual details. If you aren’t using LoyaltyLoop yet to track your customer health, click below to schedule a demo and see how we make feedback actionable.
Schedule a DemoFrequently Asked Questions
Q: Do I need to upgrade my plan to see these metric breakdowns?
A: No! This enhancement is available to all LoyaltyLoop users across all plan levels.
Q: Where can I find the respondent counts for past months?
A: Simply navigate to your CX charts and hover your mouse over any specific month to see the number of respondents and percentage breakdown for that timeframe.