New Bar Chart Default View - Feedback by Question
Reviewing trends for each of your survey questions is easy in LoyaltyLoop. Just head over to Feedback by Question. Here's a simple enhancement in LoyaltyLoop you will find valuable.
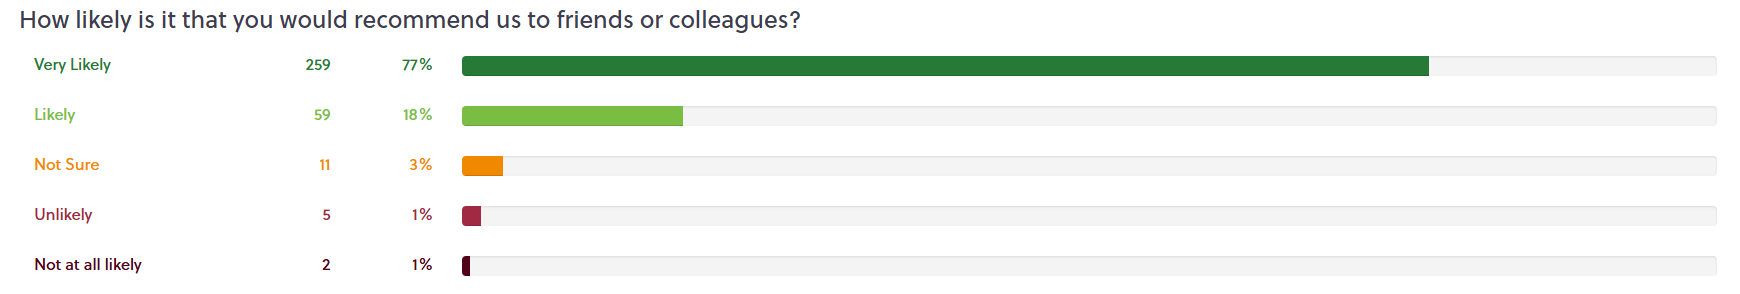
On the Feedback by Question view, you'll now notice the default chart type is set to "Bar Chart". Each question will be summarized on a horizontal bar chart. This allows you to quickly see how your customers have responded for the date range selected (default date range is 12-months to date).
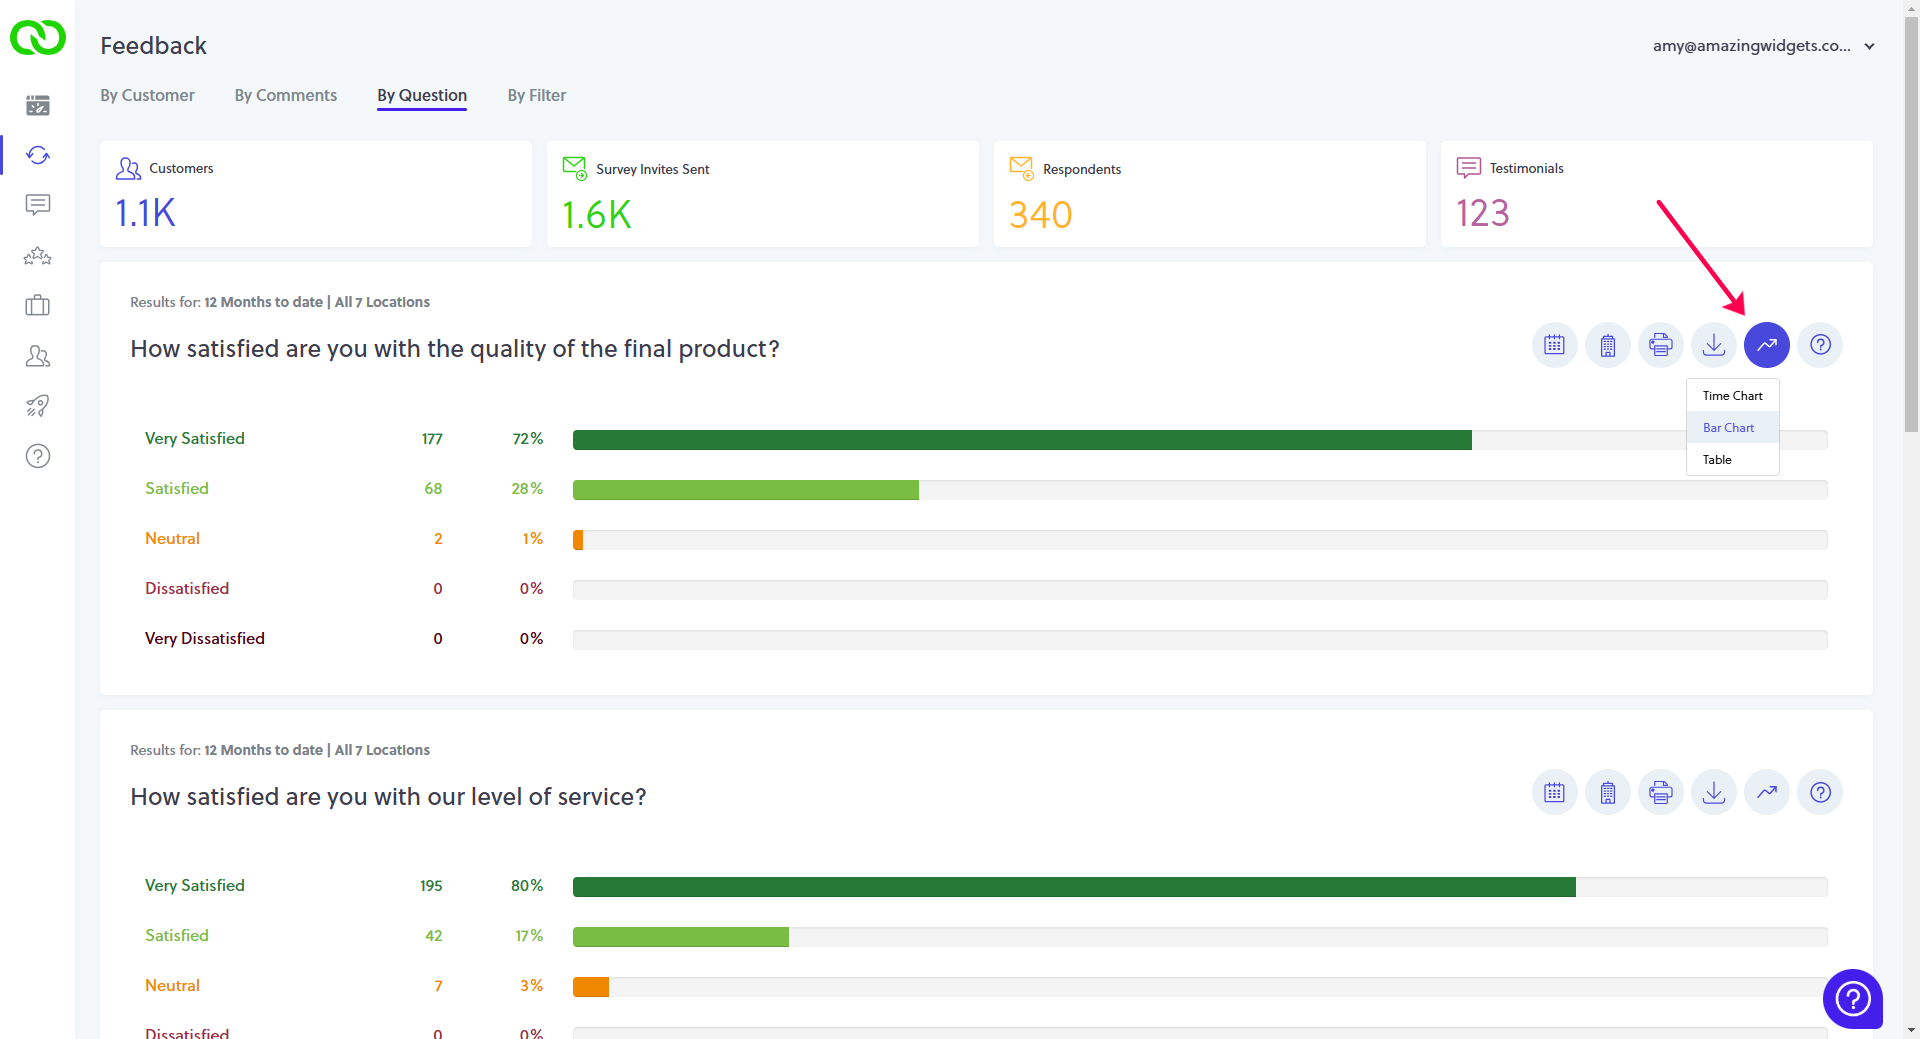
But what if you prefer to view a question using a Line Chart, or even the raw table data? No problem. Simply set the chart option you prefer, and LoyaltyLoop will remember this selection the next time you visit Feedback by Question.